20th June 2025 - Link Blog
python-importtime-graph. I was exploring why a Python tool was taking over a second to start running and I learned about the python -X importtime feature, documented here. Adding that option causes Python to spit out a text tree showing the time spent importing every module.
I tried that like this:
python -X importtime -m llm plugins
That's for LLM running 41 different plugins. Here's the full output from that command, which starts like this:
import time: self [us] | cumulative | imported package
import time:        77 |         77 |   _io
import time:        19 |         19 |   marshal
import time:       131 |        131 |   posix
import time:       363 |        590 | _frozen_importlib_external
import time:       450 |        450 |   time
import time:       110 |        559 | zipimport
import time:        64 |         64 |     _codecs
import time:       252 |        315 |   codecs
import time:       277 |        277 |   encodings.aliases
Kevin Michel built this excellent tool for visualizing these traces as a treemap. It runs in a browser - visit kmichel.github.io/python-importtime-graph/ and paste in the trace to get the visualization.
Here's what I got for that LLM example trace:
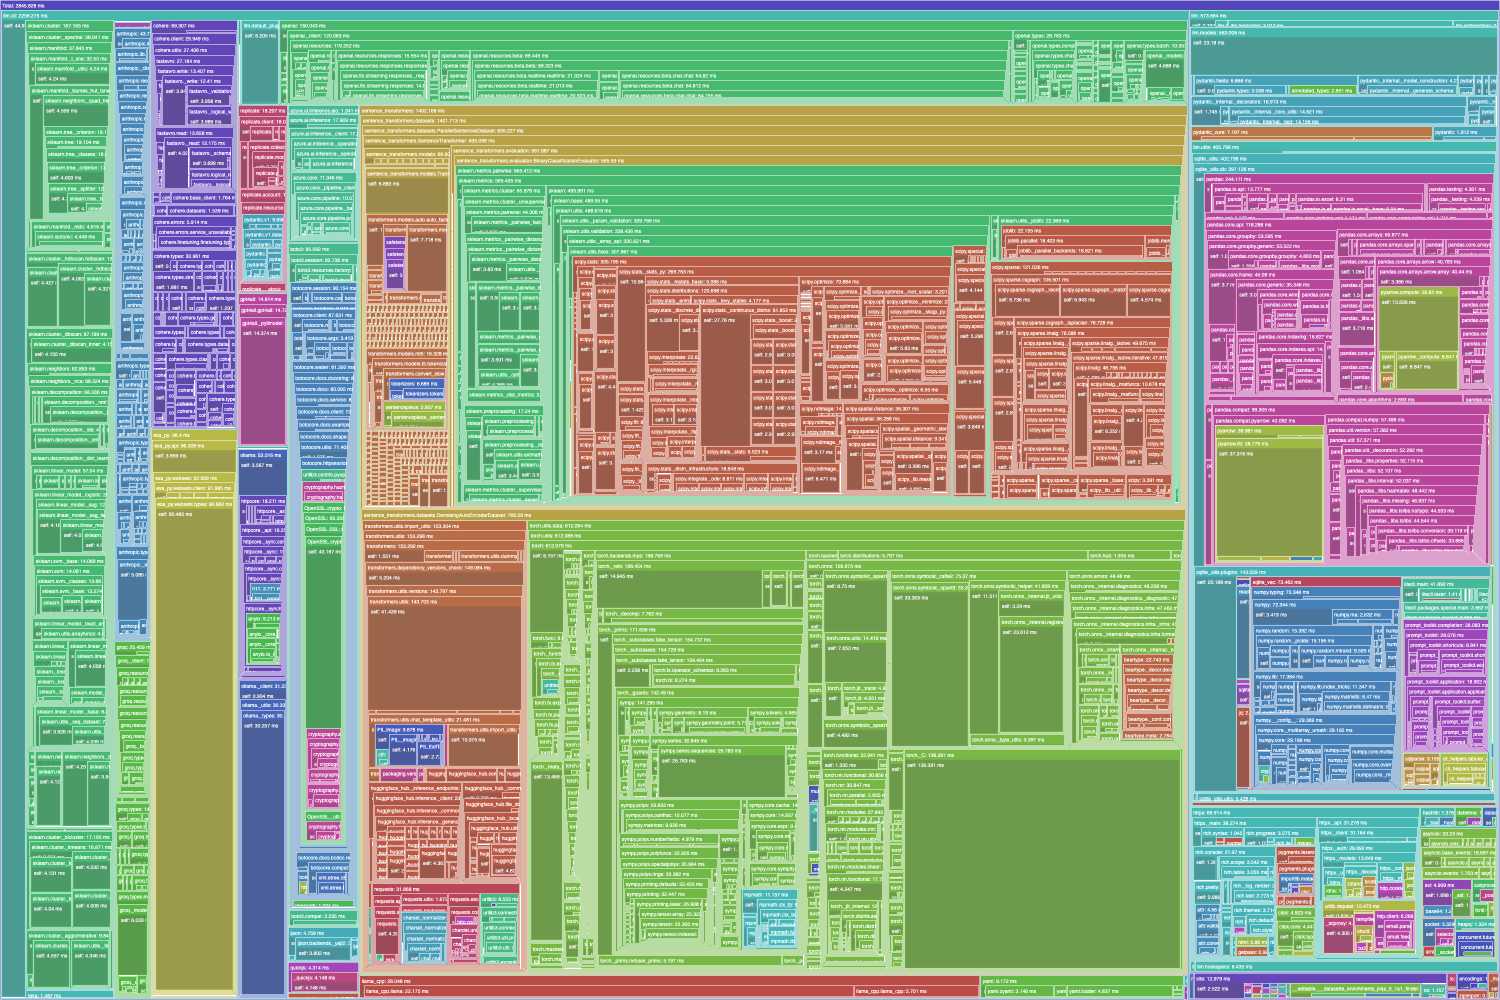
As you can see, it's pretty dense! Here's the SVG version which is a lot more readable, since you can zoom in to individual sections.
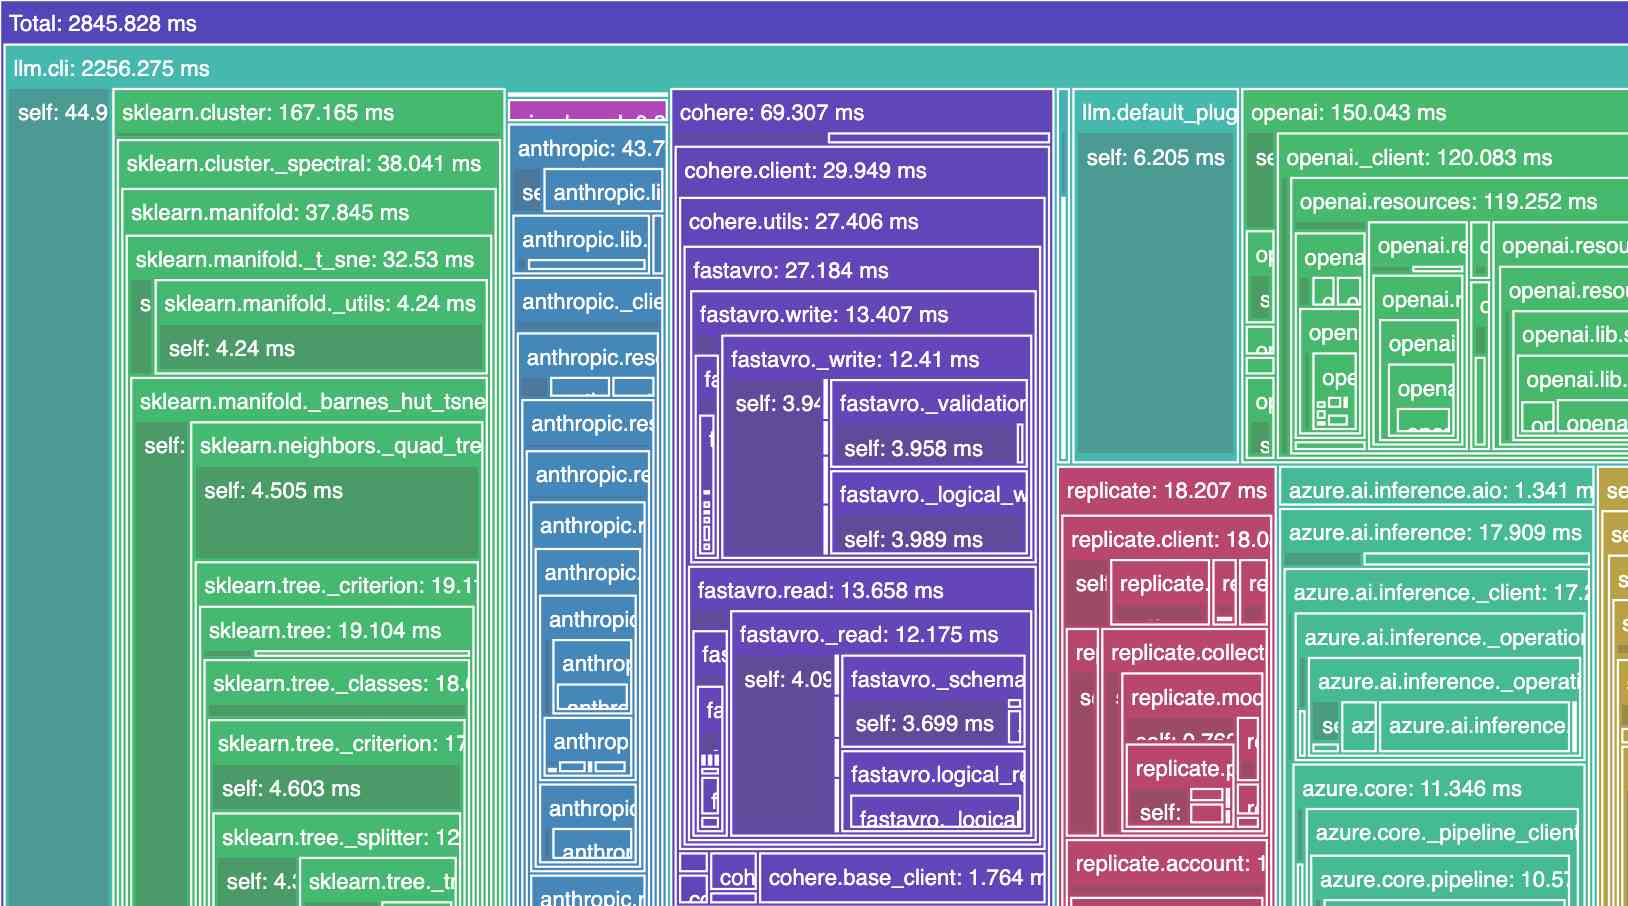
Zooming in it looks like this:
Recent articles
- Meta's new model is Muse Spark, and meta.ai chat has some interesting tools - 8th April 2026
- Anthropic's Project Glasswing - restricting Claude Mythos to security researchers - sounds necessary to me - 7th April 2026
- The Axios supply chain attack used individually targeted social engineering - 3rd April 2026