March 2019
15 posts: 2 entries, 11 links, 2 quotes
March 4, 2019
List of Physical Visualizations (via) “A chronological list of physical visualizations and related artifacts, maintained by Pierre Dragicevic and Yvonne Jansen”—327 and counting!
MySQL: How to get the top N rows for each group. MySQL doesn’t support the row_number() window function that’s available in PostgreSQL (and recent SQLite), which means it can’t easily answer questions like “for each of these authors, give me the most recent three blog entries they have written” in a single query. Only it turns out it can, if you abuse MySQL session variables in a devious way. This isn’t a new feature: MySQL has had this for over a decade, and in my rough testing it works quickly even on tables with millions of rows.
March 7, 2019
I commissioned an oil painting of Barbra Streisand’s cloned dogs
Last year, Barbra Streisand cloned her dog, Sammie.
[... 517 words]March 9, 2019
Publish the data behind your stories with SQLite and Datasette. I presented a workshop on Datasette at the IRE and NICAR CAR 2019 data journalism conference yesterday. Here’s the worksheet I prepared for the tutorial.
datasette-jellyfish. I learned about a handy Python library called Jellyfish which implements approximate and phonetic matching of strings—soundex, metaphone, porter stemming, levenshtein distance and more. I’ve built a simple Datasette plugin which wraps the library and makes each of those algorithms available as a SQL function.
March 10, 2019
D3 Projection Comparison (via) Fun Observable notebook that lets you compare any two out of D3’s 96 (!) geographical projections of the world.
March 13, 2019
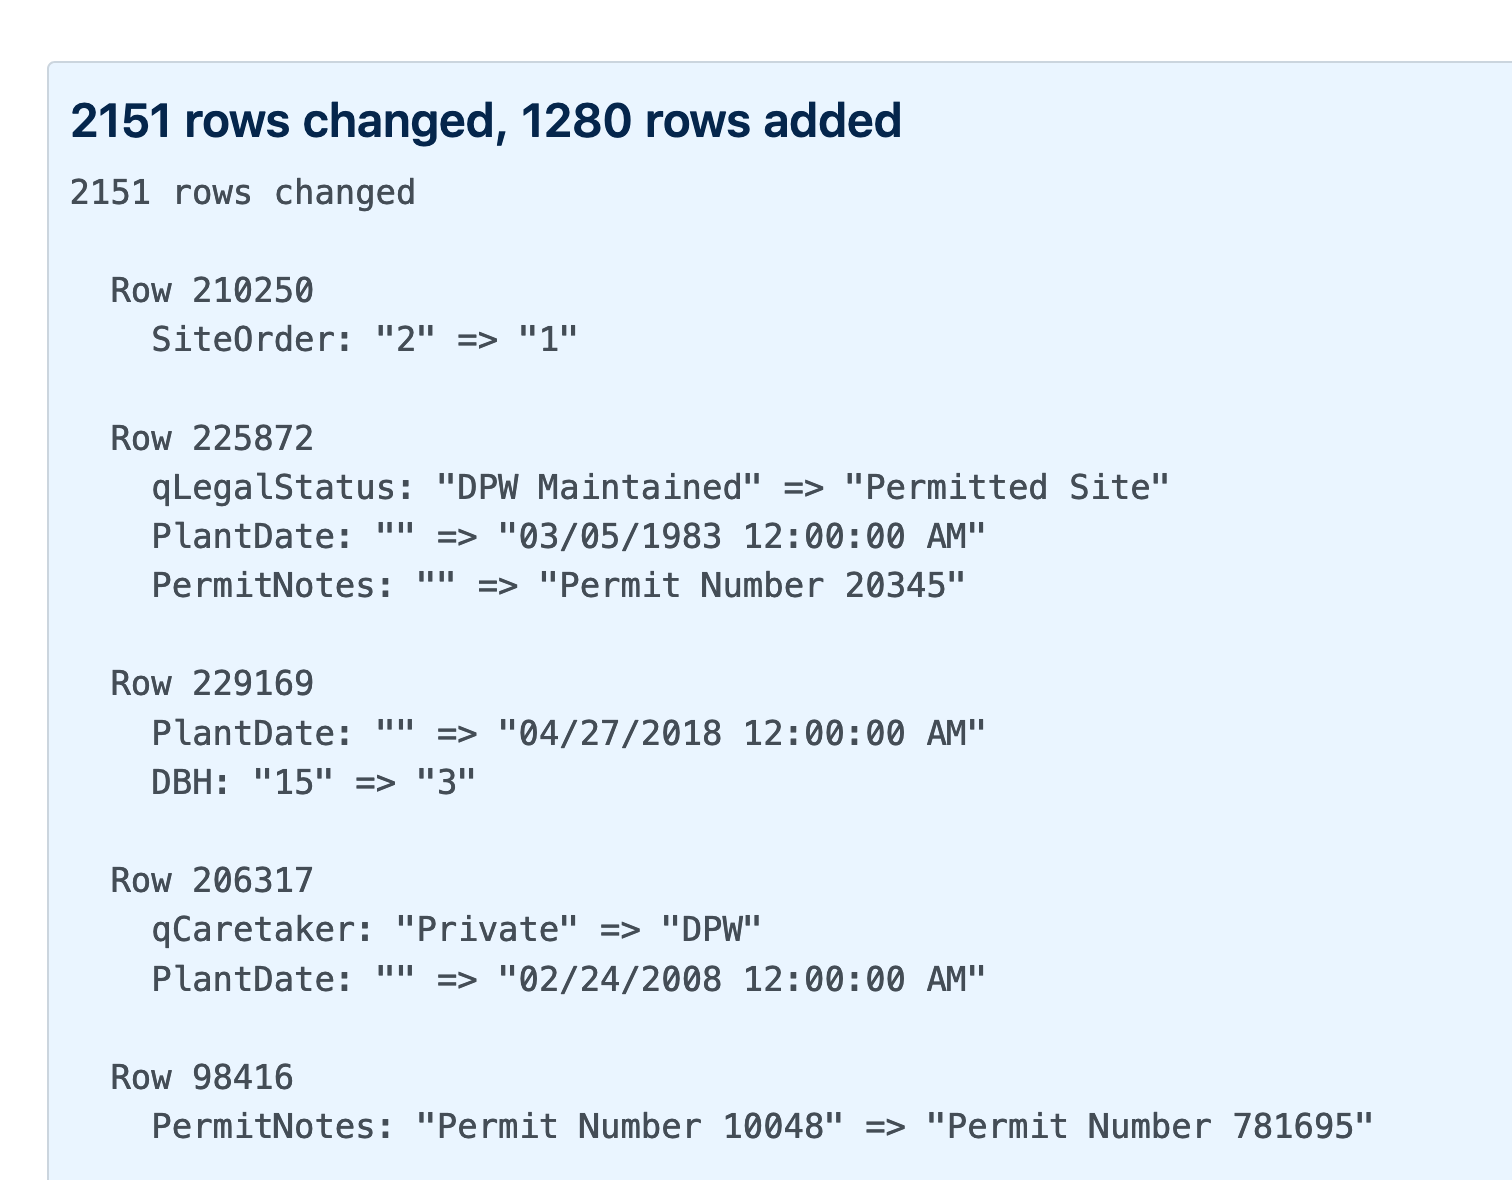
Generating a commit log for San Francisco’s official list of trees
San Francisco has a neat open data portal (as do an increasingly large number of cities these days). For a few years my favourite file on there has been Street Tree List, a list of all 190,000 trees in the city maintained by the Department of Public Works.
[... 1,051 words]March 15, 2019
Client-side instrumentation for under $1 per month. No servers necessary. (via) Rolling your own analytics used to be too complex and expensive to be worth the effort. Thanks to cloud technologies like Cloudfront, Athena, S3 and Lambda you can now inexpensively implement client-side analytics (via requests to a tracking pixel) that stores detailed logs on S3, then use Amazon Athena to run queries against those logs ($5/TB scanned) to get detailed reporting. This post also introduced me to Snowplow, an open source JavaScript analytics script (released by a commercial analytics platform) which looks very neat—it’s based on piwik.js, the tracker from the open-source Piwik analytics tool.
March 17, 2019
Don't worry about people stealing your ideas. If your ideas are any good, you'll have to ram them down people's throats.
What the Hell is Going On? (via) David Perell discusses how the shift from information scarcity to information abundance is reshaping commerce, education, and politics. Long but worthwhile.
The Cloud and Open Source Powder Keg (via) Stephen O’Grady’s analysis of the Elastic v.s. AWS situation, where Elastic started mixing their open source and non-open source code together and Amazon responded by releasing their own forked “open distribution for Elasticsearch”. World War One analogies included!
March 18, 2019
VisiData
(via)
Intriguing tool by Saul Pwanson: VisiData is a command-line "textpunk utility" for browsing and manipulating tabular data. pip3 install visidata and then vd myfile.csv (or .json or .xls or SQLite or others) and get an interactive terminal UI for quickly searching through the data, conducting frequency analysis of columns, manipulating it and much more besides. Two tips for if you start playing with it: hit gq to exit, and hit Ctrl+H to view the help screen.
March 28, 2019
Programmer migration patterns. Avery Pennarun explores the history of modern programming languages and how developers have migrated from one to another over time. Lots of fun insights in this.
The Next CEO of Stack Overflow. “Including the Stack Exchange network of 174 sites, we have over 100 million monthly visitors. Every month, over 125,000 wonderful people write answers”—this fits the rule of thumb for user-generated content that only a tiny portion of your audience will actively create content: in this case it’s just 0.125% (one eighth of one percent). I’d love to know how many people are upvoting or performing other more lightweight interactions.
For the Fairmont, the Tonga Room is an inherited embarrassment, as though it were a local lord whose ancestors captured a repellent goblin and chained him up in the cellar, but the goblin is inexplicably adored by the townsfolk and the children, who sneak the goblin food and treats, and cry when the goblin’s master moves to strike it.

