Sunday, 4th April 2021
TIL
Useful Markdown extensions in Python
— I wanted to render some markdown in Python but with the following extra features:
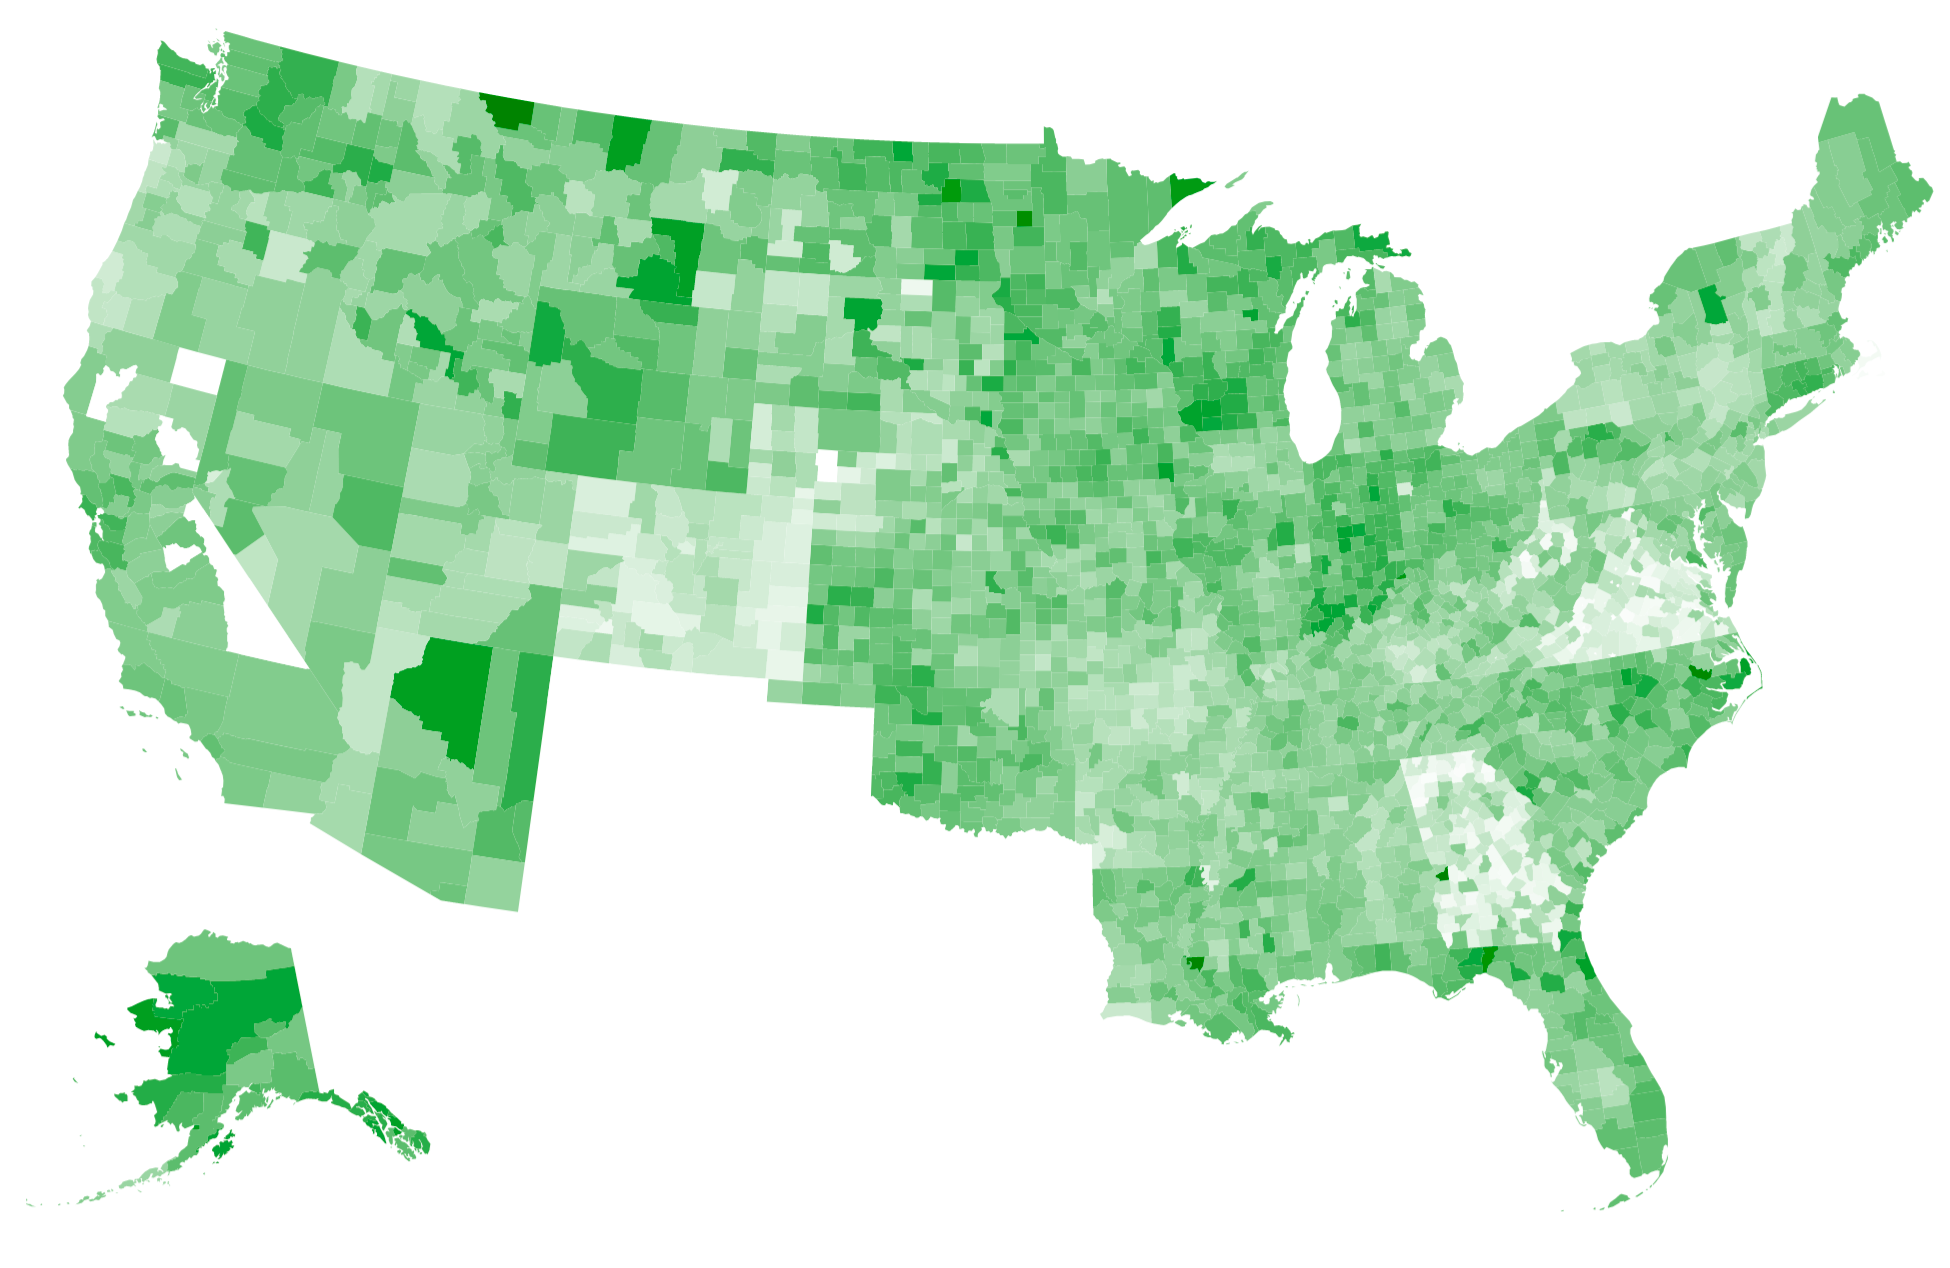
Animated choropleth of vaccinations by US county
Last week I mentioned that I’ve recently started scraping and storing the CDC’s per-county vaccination numbers in my cdc-vaccination-history GitHub repository. This week I used an Observable notebook and d3’s TopoJSON support to render those numbers on an animated choropleth map.
[... 1,138 words]Spatialite Speed Test. Part of an excellent series of posts about SpatiaLite from 2012—here John C. Zastrow reports on running polygon intersection queries against a 1.9GB database file in 40 seconds without an index and 0.186 seconds using the SpatialIndex virtual table mechanism.
TIL
Language-specific indentation settings in VS Code
— When I'm working with Python I like four space indents, but for JavaScript or HTML I like two space indents.
