21st August 2021
TIL
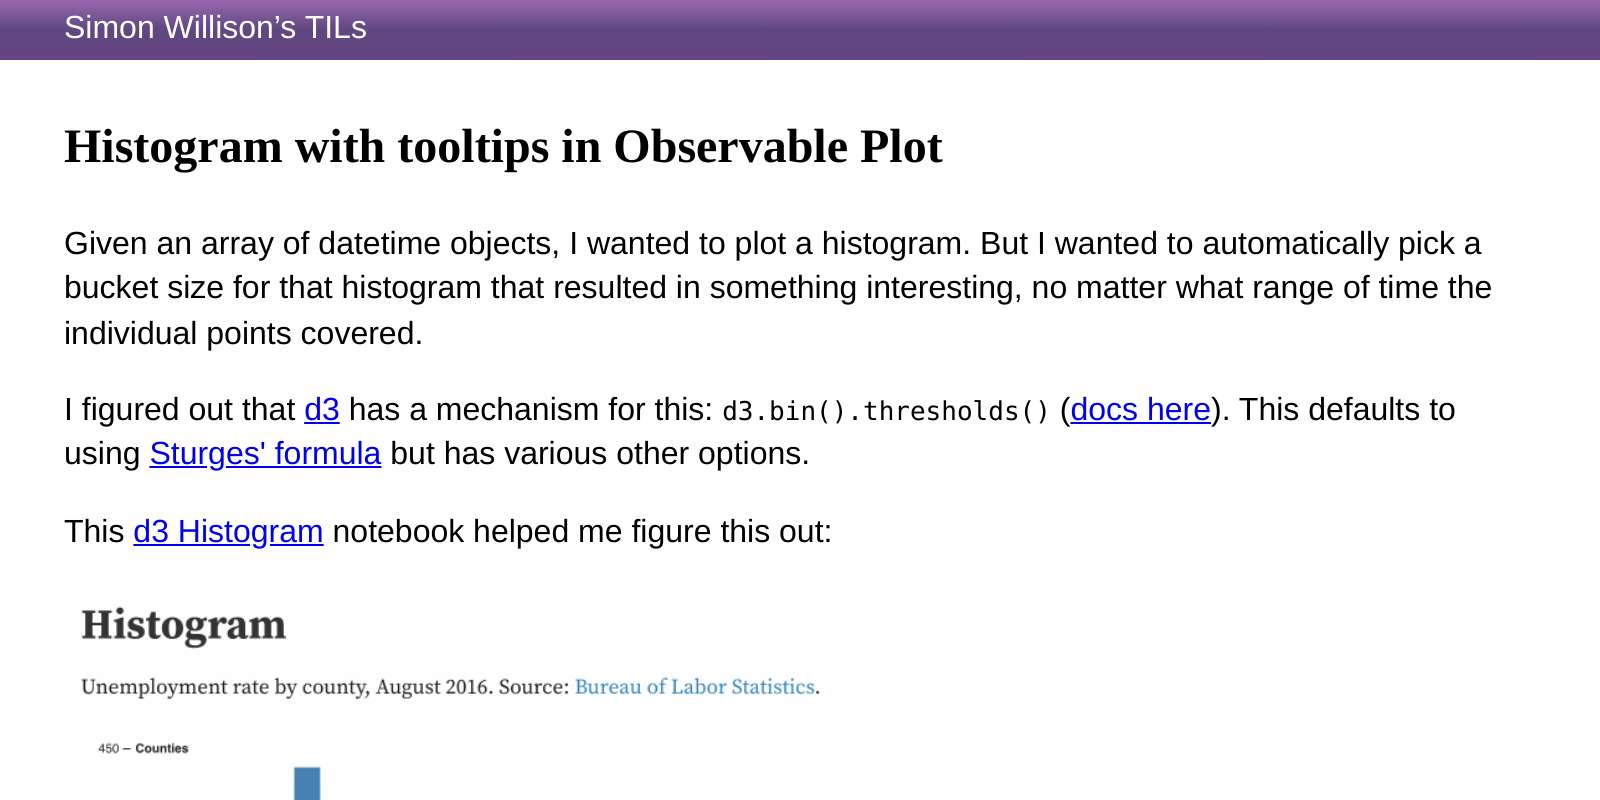
Histogram with tooltips in Observable Plot
— Given an array of datetime objects, I wanted to plot a histogram. But I wanted to automatically pick a bucket size for that histogram that resulted in something interesting, no matter what range of time the individual points covered.
Recent articles
- Anthropic's Project Glasswing - restricting Claude Mythos to security researchers - sounds necessary to me - 7th April 2026
- The Axios supply chain attack used individually targeted social engineering - 3rd April 2026
- Highlights from my conversation about agentic engineering on Lenny's Podcast - 2nd April 2026