21st August 2021
TIL
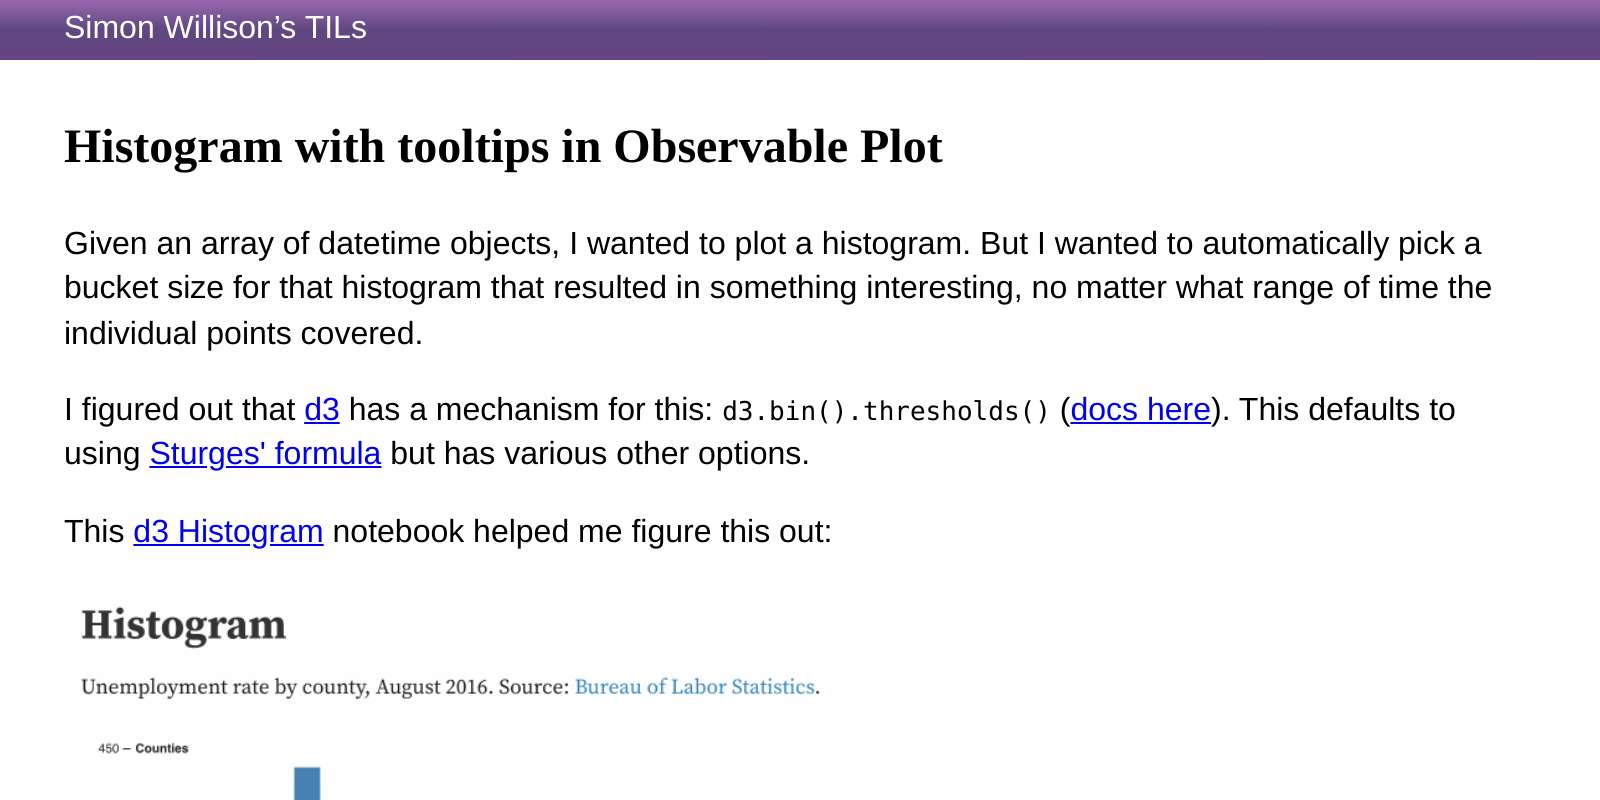
Histogram with tooltips in Observable Plot
— Given an array of datetime objects, I wanted to plot a histogram. But I wanted to automatically pick a bucket size for that histogram that resulted in something interesting, no matter what range of time the individual points covered.
Recent articles
- Kimi K3, and what we can still learn from the pelican benchmark - 16th July 2026
- The new GPT-5.6 family: Luna, Terra, Sol - 9th July 2026
- sqlite-utils 4.0, now with database schema migrations - 7th July 2026