Analytics: Hacker News v.s. a tweet from Elon Musk
17th February 2023
My post Bing: “I will not harm you unless you harm me first” really took off.
It sat at the top of Hacker News for a full day, and is currently the 18th most popular post of all time on that site.
And then this happened:
Might need a bit more polish …https://t.co/rGYCxoBVeA
- Elon Musk (@elonmusk) February 15, 2023
Given recent changes made to the Twitter algorithm, a lot of people saw that. Twitter currently reports 30.4M views of that tweet.
A bunch of people asked me how much of that converted into page views. So let’s dive in!
Headline figures
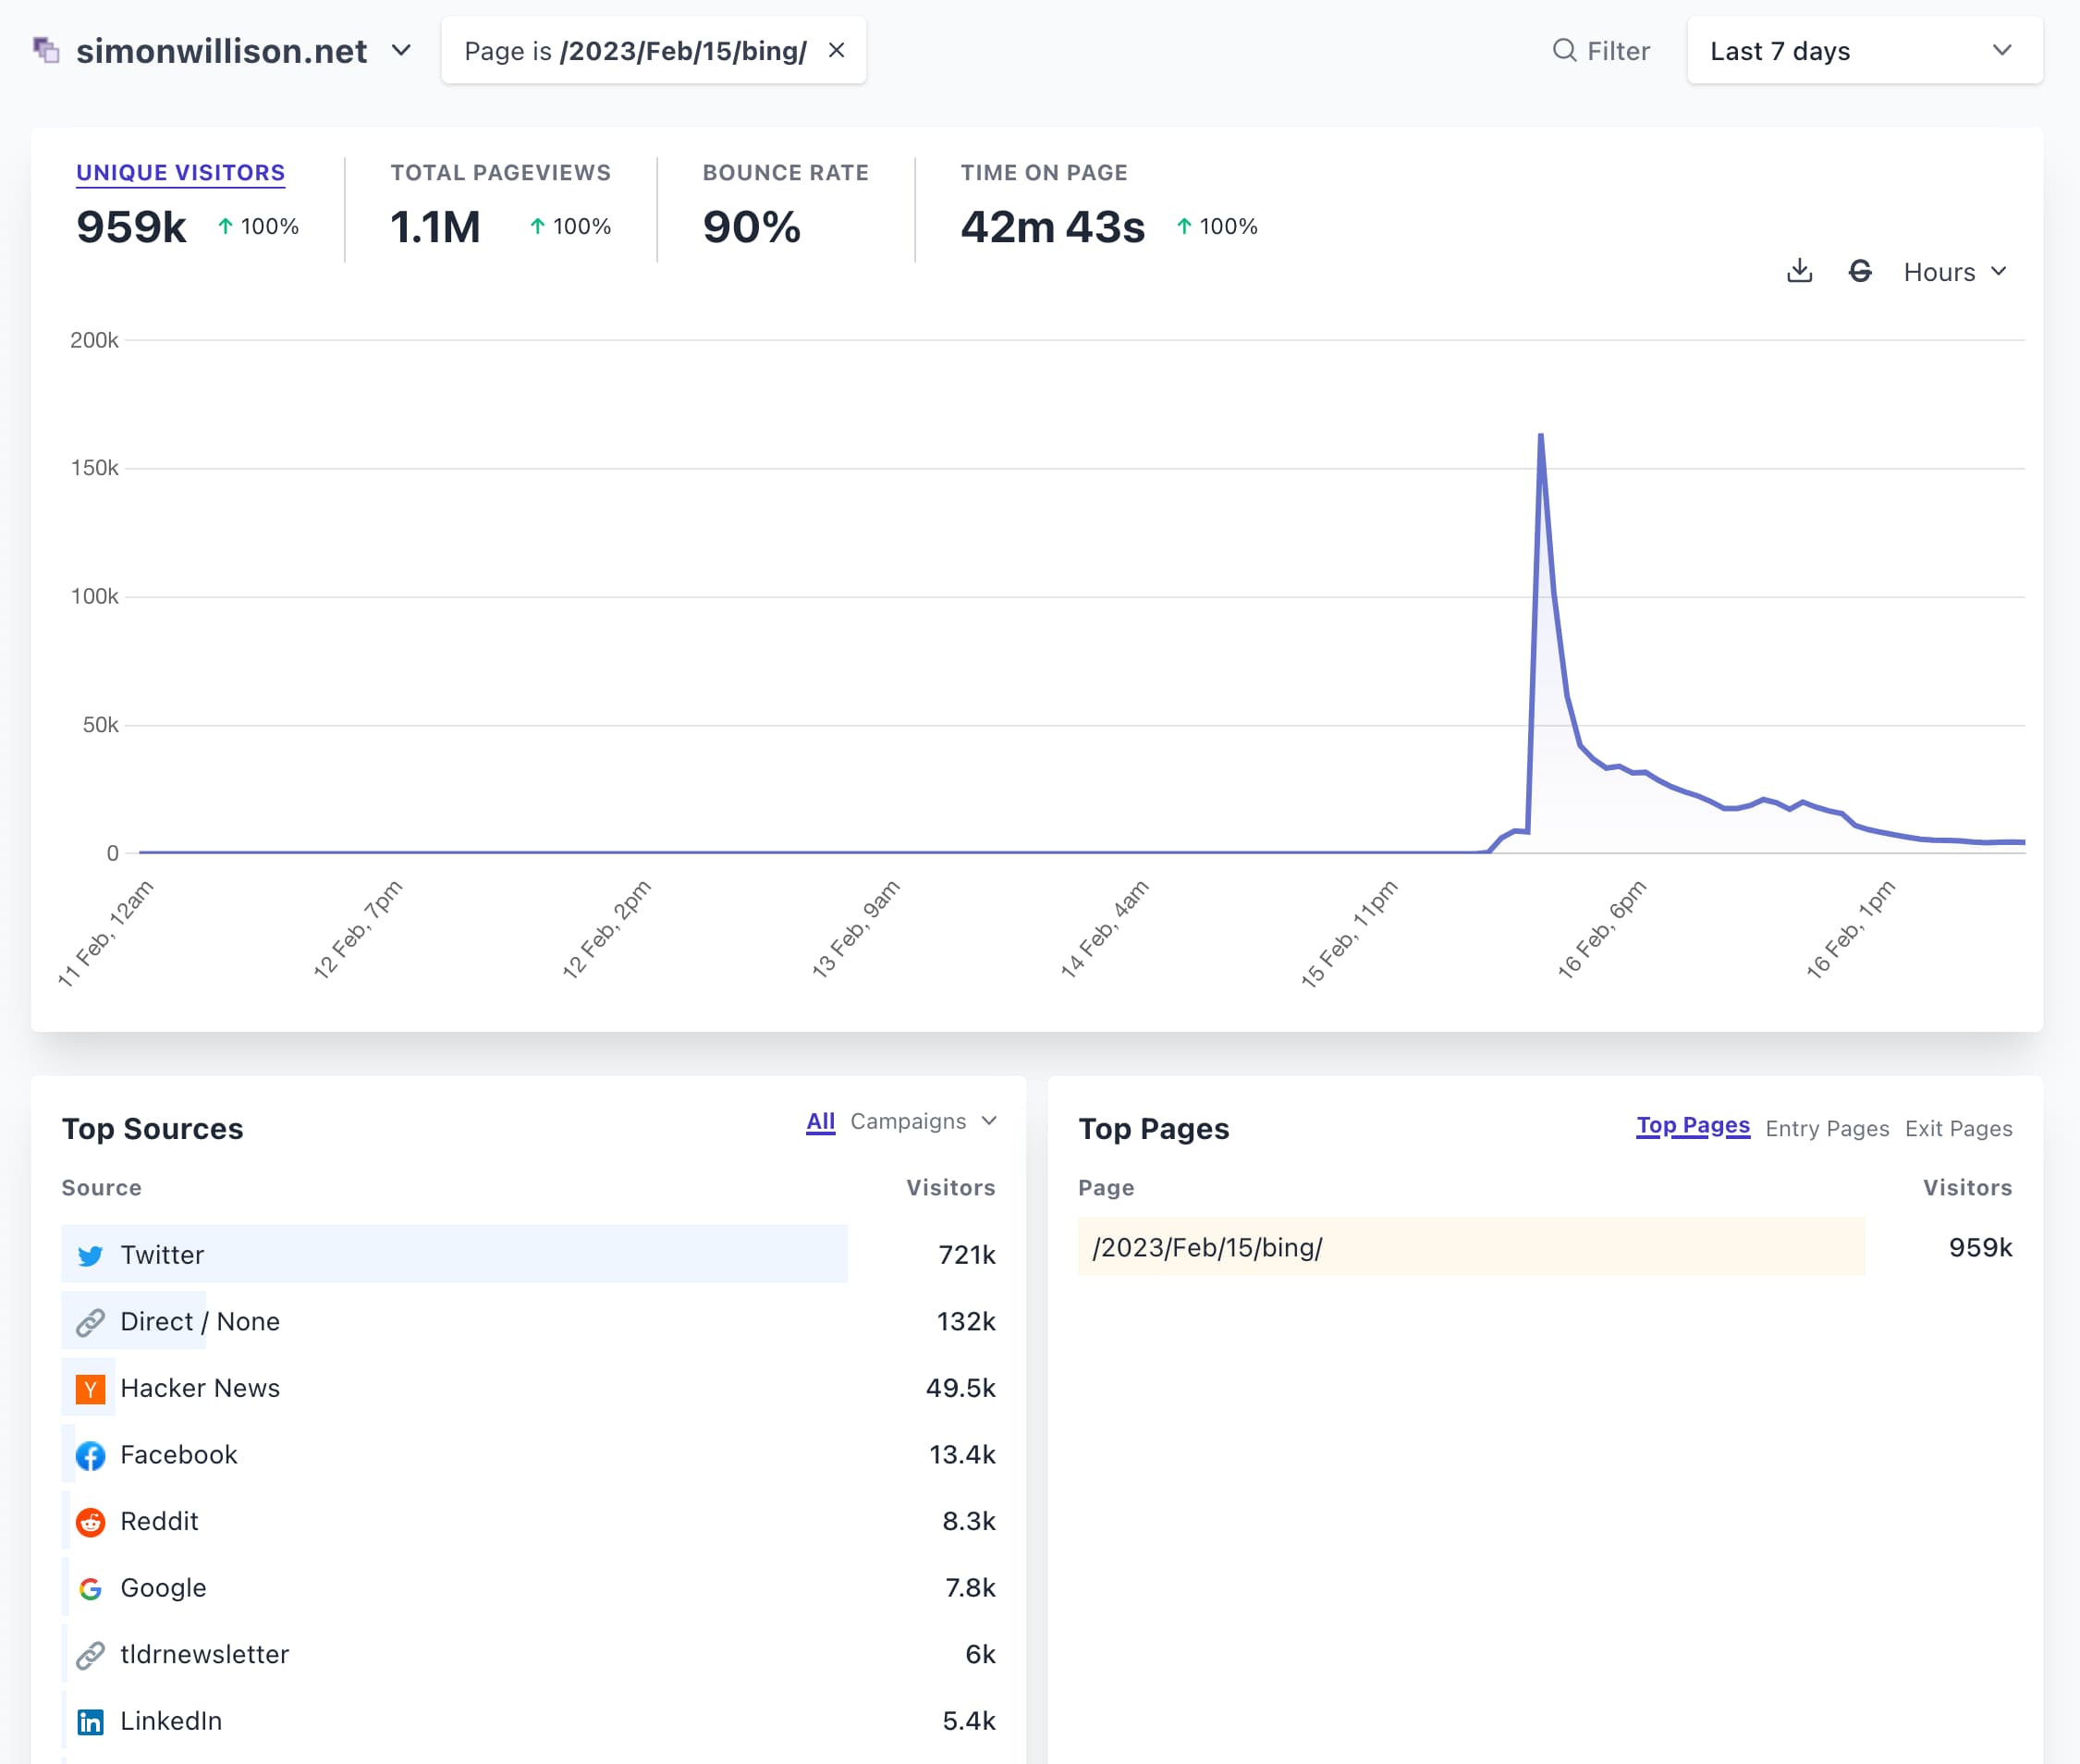
Here’s my Plausible dashboard for that post over the past few days:

Overall numbers: 959k unique visitors, 1.1M page views.
Top sources of traffic:
- Twitter: 721k
- Direct / None: 132k (this includes traffic from Mastodon)
- Hacker News: 49.5k
- Facebook: 13.4k
- Reddit: 8.3k
- Google: 7.8k
- tldrnewsletter: 6k
- LinkedIn: 5.4k
If we assume the vast majority of the Twitter traffic was from Elon (which seems reasonable) that’s 30.4M / 721k = roughly a 2.37% click through rate.
Notable that sticking at the top of Hacker News for a day really does drive an enormous amount of traffic—18% of the traffic you get from the second most followed account on Twitter (looks like Barack Obama is still number one).
More detailed analytics via Plausible and Cloudflare
I mainly use Plausible for my site’s analytics. I really like them: they’re privacy-focused, open source (though I use their hosted version) and show me exactly the subset of data I want to see. Most importantly, they don’t set cookies.
My site also runs behind Cloudflare, which also provides analytics. I don’t pay for the upgraded analytics, but it turns out you can still get some pretty detailed numbers out of them—especially if you’re willing to dig around in the browser DevTools.
Plausible offers an “export” button, so I used that... and got a zip file with a bunch of CSVs in it. Here they are in a GitHub repo.
Cloudflare—at least for the free tier—doesn’t have a detailed export. But... under the hood the Cloudflare web application uses their GraphQL API to retrieve stats for display, and with a bit of digging you can get numbers out that way.
I extracted this 3.2MB JSON file using the Cloudflare API.
Loading it into Datasette
I wrote this script to load the data I had extracted into SQLite database files, and then deployed them to Vercel using Datasette.
You can explore the result here: https://i-will-not-harm-you-unless-you-harm-me-first.vercel.app/
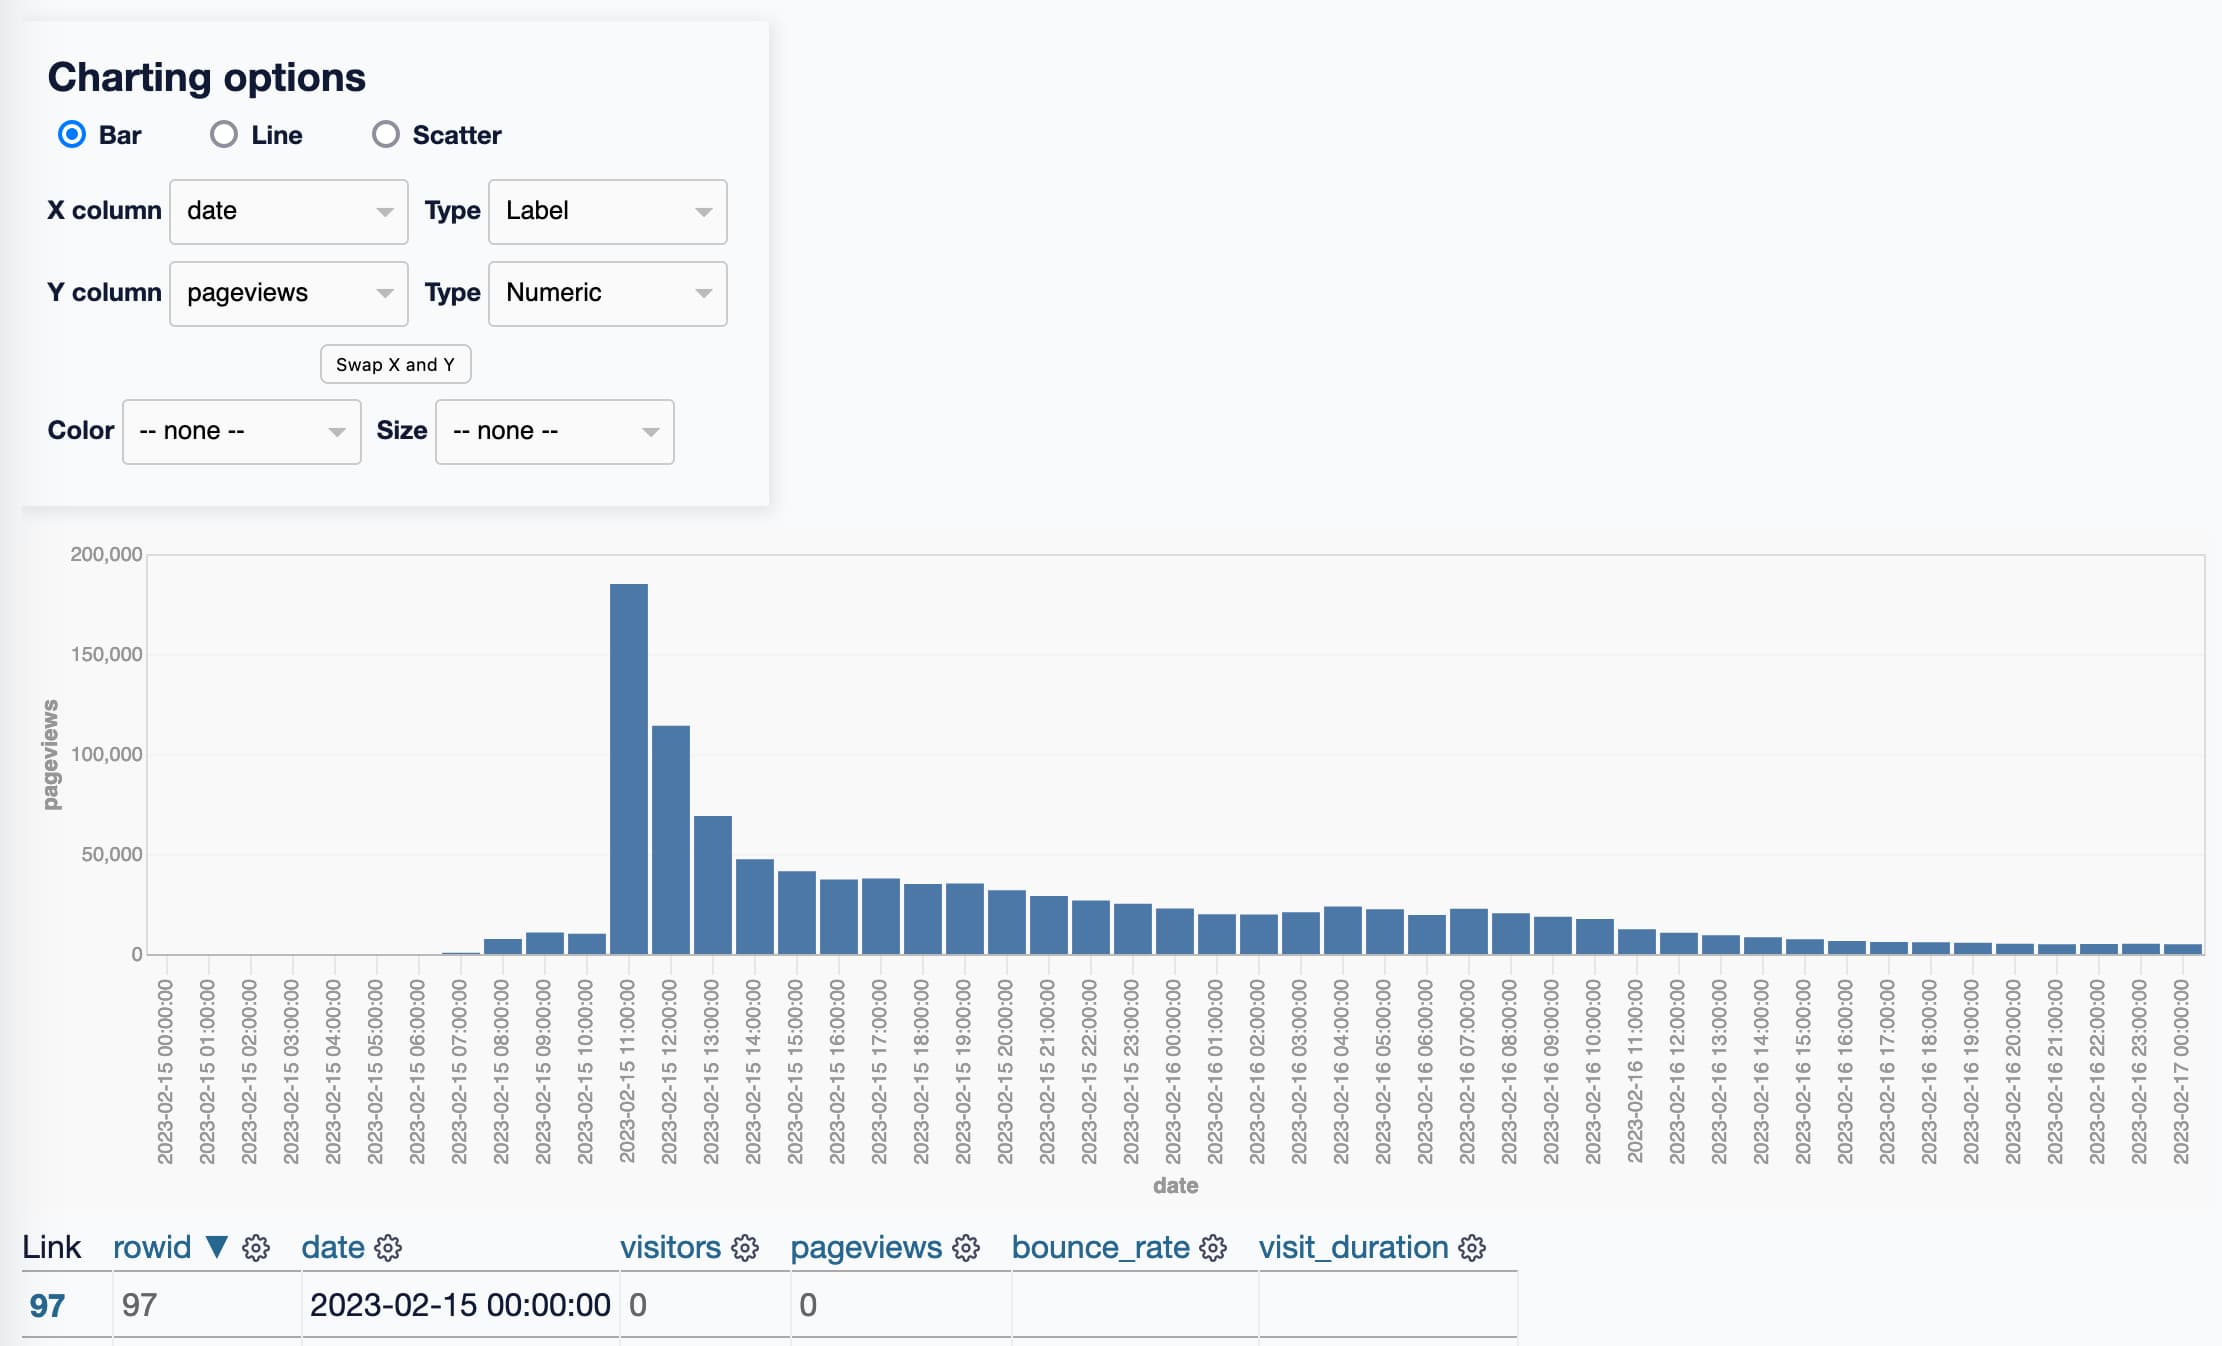
Here’s page views according to Plausible over the time period in question:

It looks to me like the timezone for that data is Pacific Time.
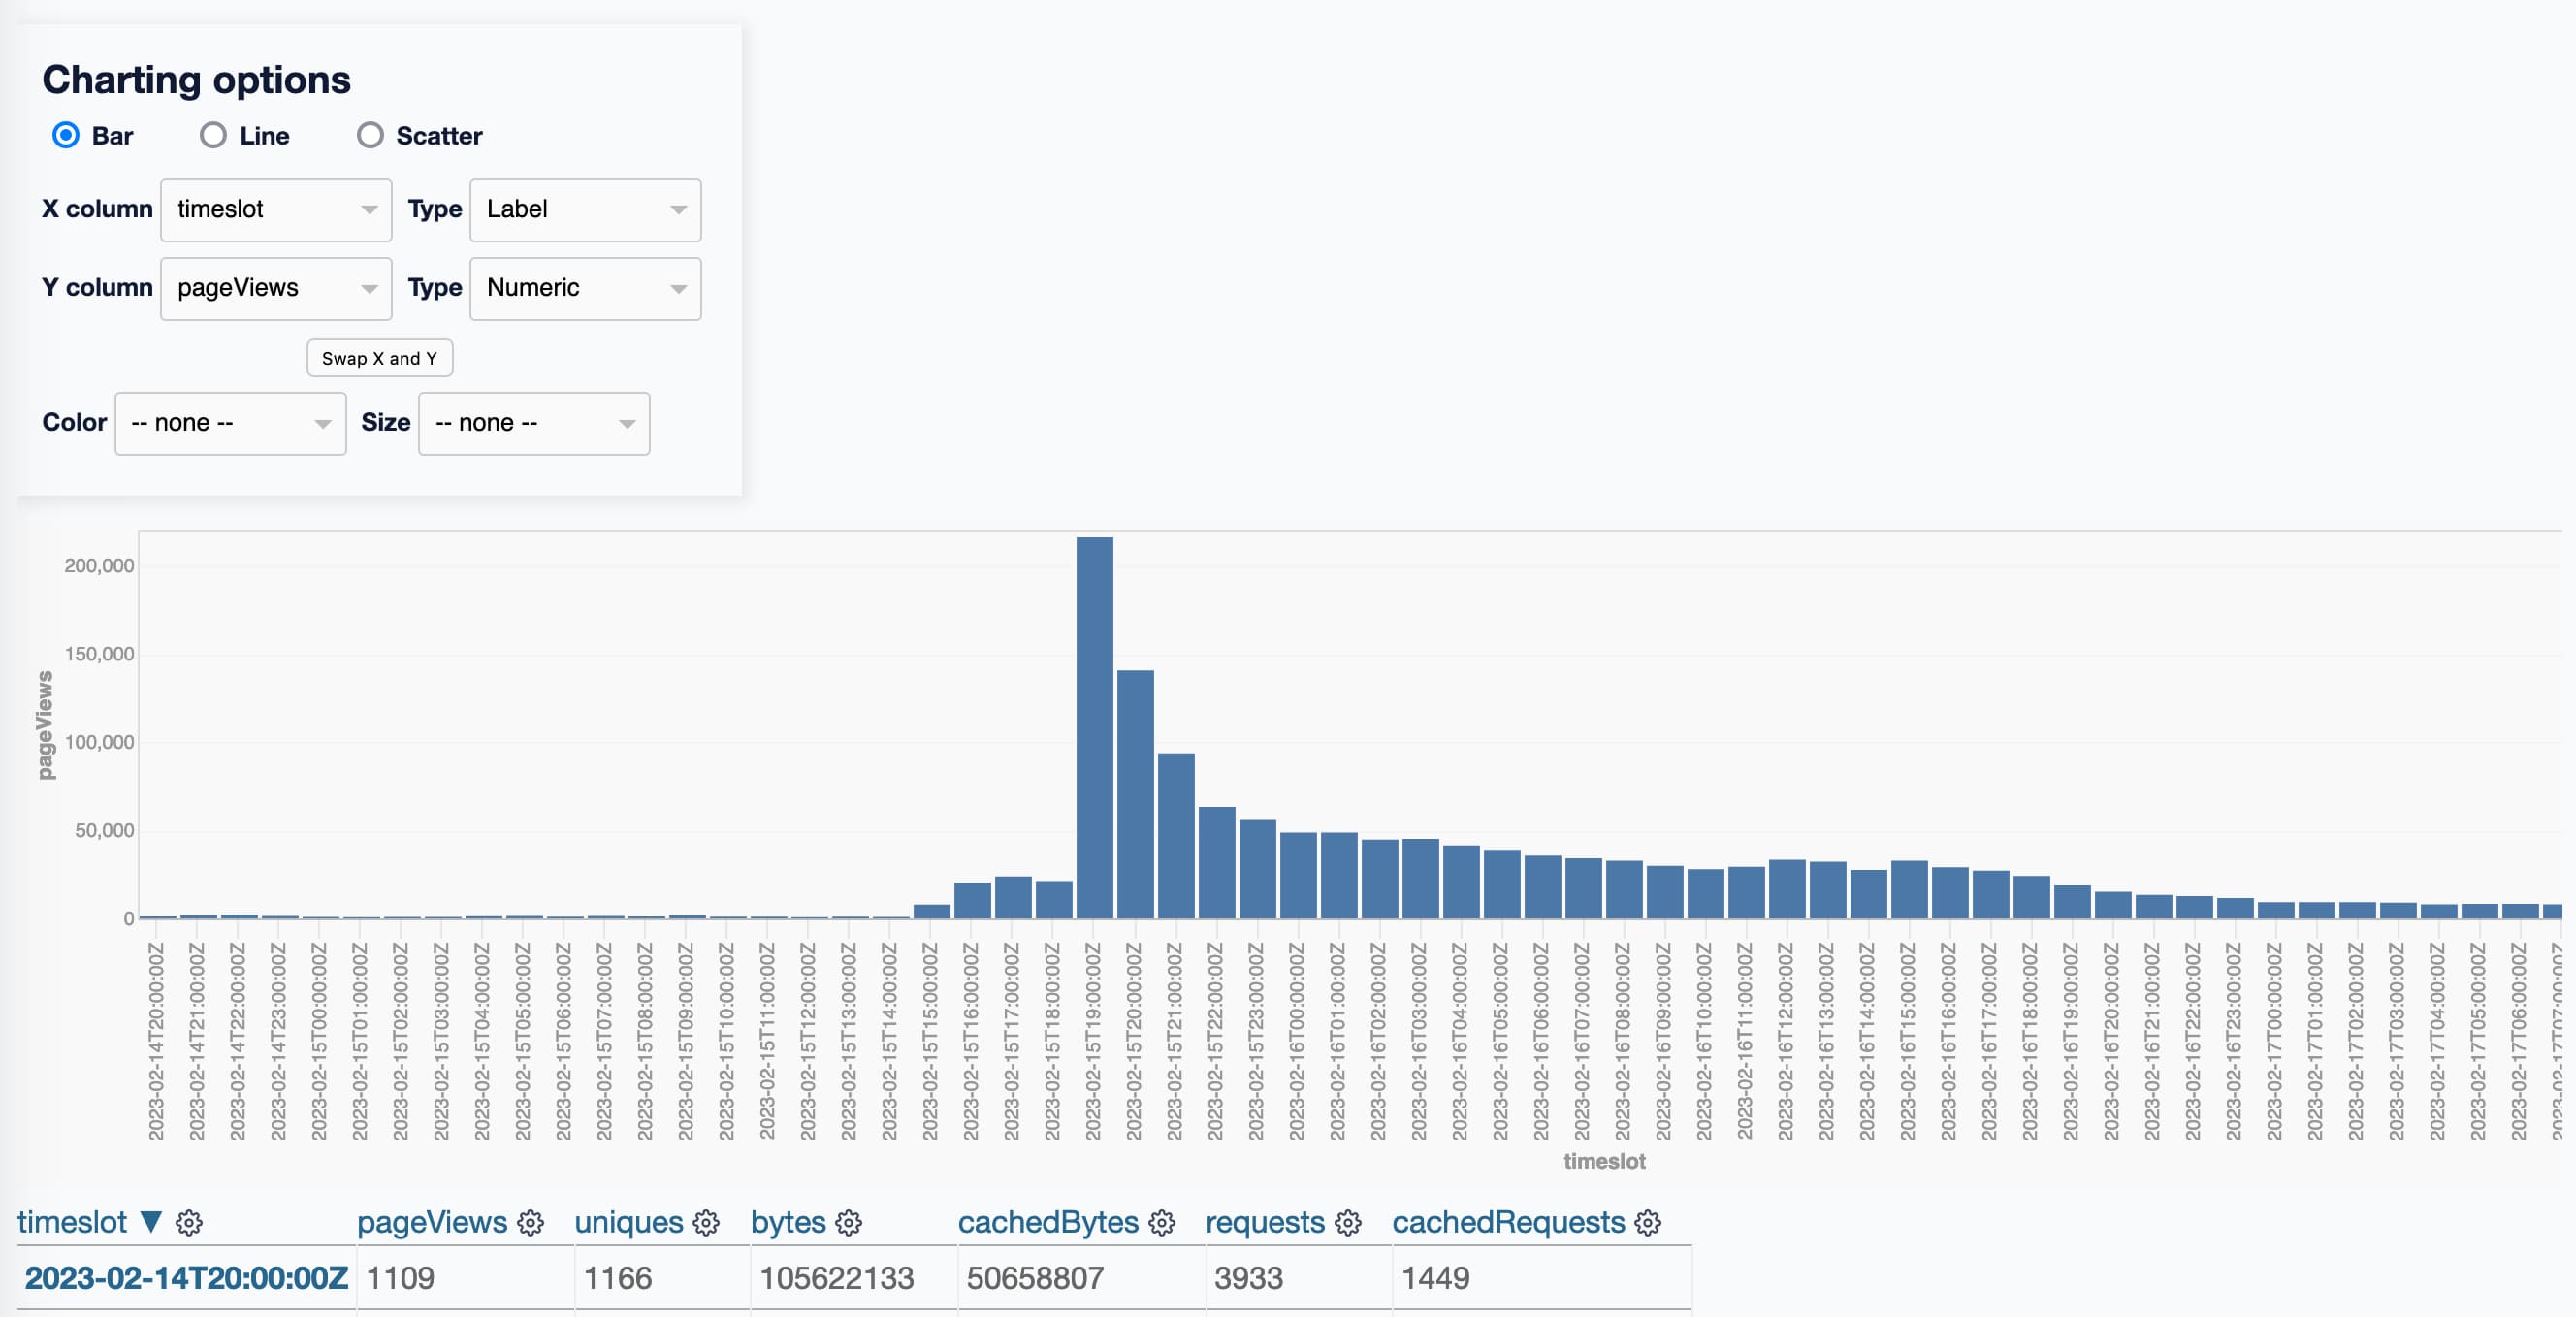
This page shows page views count according to Cloudflare, by hour.

This data is in UTC, where 7pm UTC corresponds to 11am Pacific.
These numbers should differ, because Plausible uses JavaScript to track analytics while Cloudflare is server-side, plus Plausible is filtered to just hits to the specific page while Cloudflare is showing all hits to any page on my site.
There are plenty more ways to slice and dice the data in Datasette:
- Unique visitors over time according to Plausible
- Uniques over time according to Cloudflare
- Full data for those traffic sources from Plausible
- Plausible device breakdown—778,678 mobile, 101,216 desktop, 47,781 laptop (not sure how it distinguishes between desktop and laptop though), 16,967 tablet.
- Percentage of cached requests over time according to Cloudflare using a custom SQL query—this was around 40% before the Elon tweet, then jumped up to over 90% and stayed there, thankfully!
I’ve long been a fan of full-page HTTP caching as protection against surprise traffic events—it’s a pattern I’ve implemented in the past using Varnish and Fastly, and I’ve been using it on my blog via Cloudflare for several years.
It definitely paid off this time!
More recent articles
- The evolution of OpenAI's mission statement - 13th February 2026
- Introducing Showboat and Rodney, so agents can demo what they’ve built - 10th February 2026
- How StrongDM's AI team build serious software without even looking at the code - 7th February 2026