14 posts tagged “benchmarks”
2026
SWE-bench February 2026 leaderboard update (via) SWE-bench is one of the benchmarks that the labs love to list in their model releases. The official leaderboard is infrequently updated but they just did a full run of it against the current generation of models, which is notable because it's always good to see benchmark results like this that weren't self-reported by the labs.
The fresh results are for their "Bash Only" benchmark, which runs their mini-swe-bench agent (~9,000 lines of Python, here are the prompts they use) against the SWE-bench dataset of coding problems - 2,294 real-world examples pulled from 12 open source repos: django/django (850), sympy/sympy (386), scikit-learn/scikit-learn (229), sphinx-doc/sphinx (187), matplotlib/matplotlib (184), pytest-dev/pytest (119), pydata/xarray (110), astropy/astropy (95), pylint-dev/pylint (57), psf/requests (44), mwaskom/seaborn (22), pallets/flask (11).
Correction: The Bash only benchmark runs against SWE-bench Verified, not original SWE-bench. Verified is a manually curated subset of 500 samples described here, funded by OpenAI. Here's SWE-bench Verified on Hugging Face - since it's just 2.1MB of Parquet it's easy to browse using Datasette Lite, which cuts those numbers down to django/django (231), sympy/sympy (75), sphinx-doc/sphinx (44), matplotlib/matplotlib (34), scikit-learn/scikit-learn (32), astropy/astropy (22), pydata/xarray (22), pytest-dev/pytest (19), pylint-dev/pylint (10), psf/requests (8), mwaskom/seaborn (2), pallets/flask (1).
Here's how the top ten models performed:
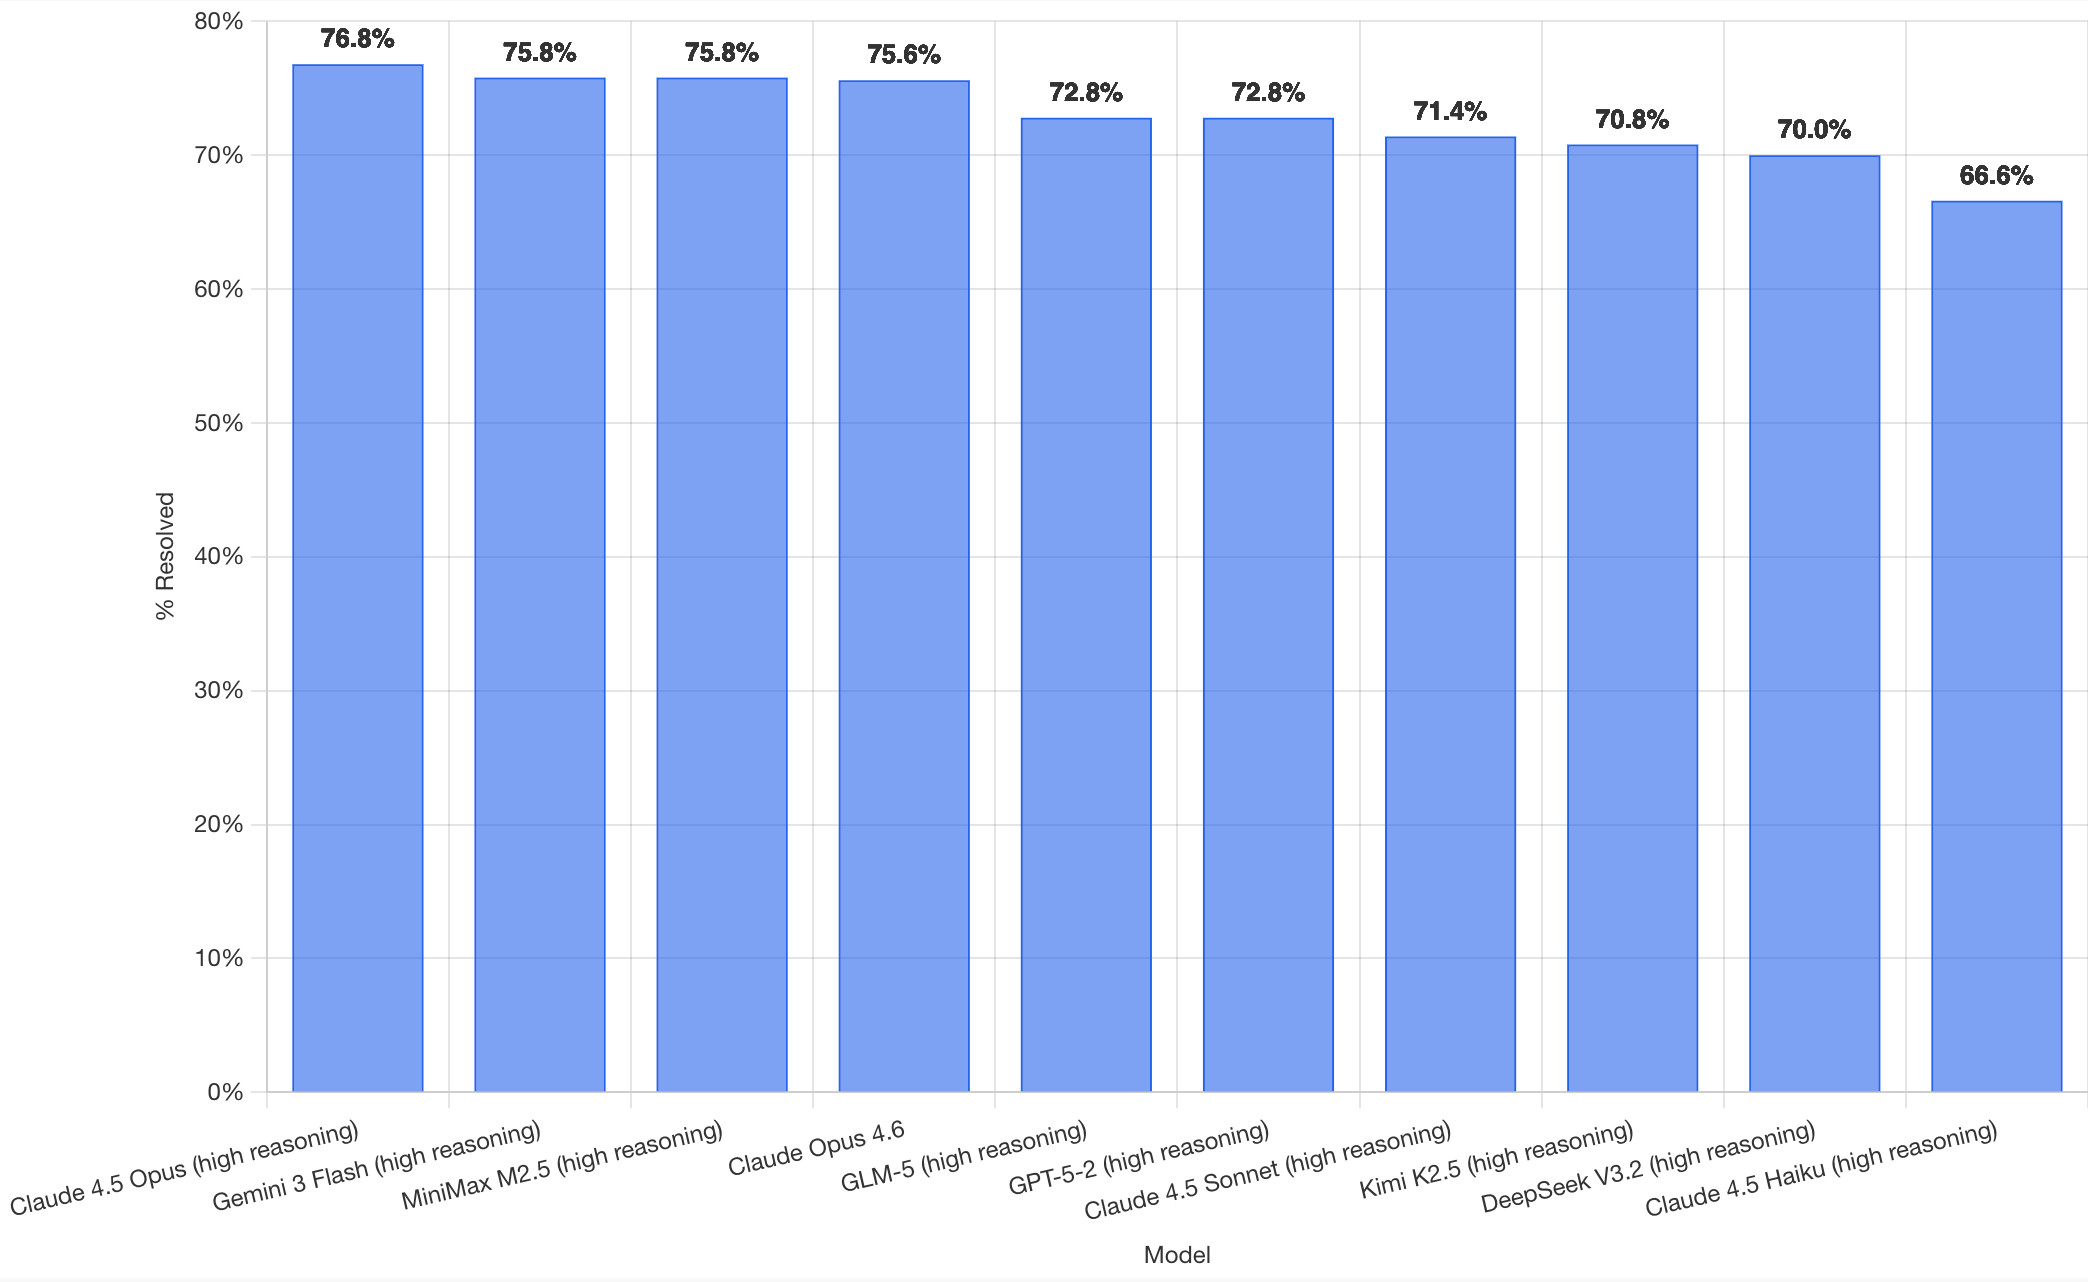
It's interesting to see Claude Opus 4.5 beat Opus 4.6, though only by about a percentage point. 4.5 Opus is top, then Gemini 3 Flash, then MiniMax M2.5 - a 229B model released last week by Chinese lab MiniMax. GLM-5, Kimi K2.5 and DeepSeek V3.2 are three more Chinese models that make the top ten as well.
OpenAI's GPT-5.2 is their highest performing model at position 6, but it's worth noting that their best coding model, GPT-5.3-Codex, is not represented - maybe because it's not yet available in the OpenAI API.
This benchmark uses the same system prompt for every model, which is important for a fair comparison but does mean that the quality of the different harnesses or optimized prompts is not being measured here.
The chart above is a screenshot from the SWE-bench website, but their charts don't include the actual percentage values visible on the bars. I successfully used Claude for Chrome to add these - transcript here. My prompt sequence included:
Use claude in chrome to open https://www.swebench.com/
Click on "Compare results" and then select "Select top 10"
See those bar charts? I want them to display the percentage on each bar so I can take a better screenshot, modify the page like that
I'm impressed at how well this worked - Claude injected custom JavaScript into the page to draw additional labels on top of the existing chart.
![Screenshot of a Claude AI conversation showing browser automation. A thinking step reads "Pivoted strategy to avoid recursion issues with chart labeling >" followed by the message "Good, the chart is back. Now let me carefully add the labels using an inline plugin on the chart instance to avoid the recursion issue." A collapsed "Browser_evaluate" section shows a browser_evaluate tool call with JavaScript code using Chart.js canvas context to draw percentage labels on bars: meta.data.forEach((bar, index) => { const value = dataset.data[index]; if (value !== undefined && value !== null) { ctx.save(); ctx.textAlign = 'center'; ctx.textBaseline = 'bottom'; ctx.fillStyle = '#333'; ctx.font = 'bold 12px sans-serif'; ctx.fillText(value.toFixed(1) + '%', bar.x, bar.y - 5); A pending step reads "Let me take a screenshot to see if it worked." followed by a completed "Done" step, and the message "Let me take a screenshot to check the result."](https://static.simonwillison.net/static/2026/claude-chrome-draw-on-chart.jpg)
Update: If you look at the transcript Claude claims to have switched to Playwright, which is confusing because I didn't think I had that configured.
2025
LLM SVG Generation Benchmark
(via)
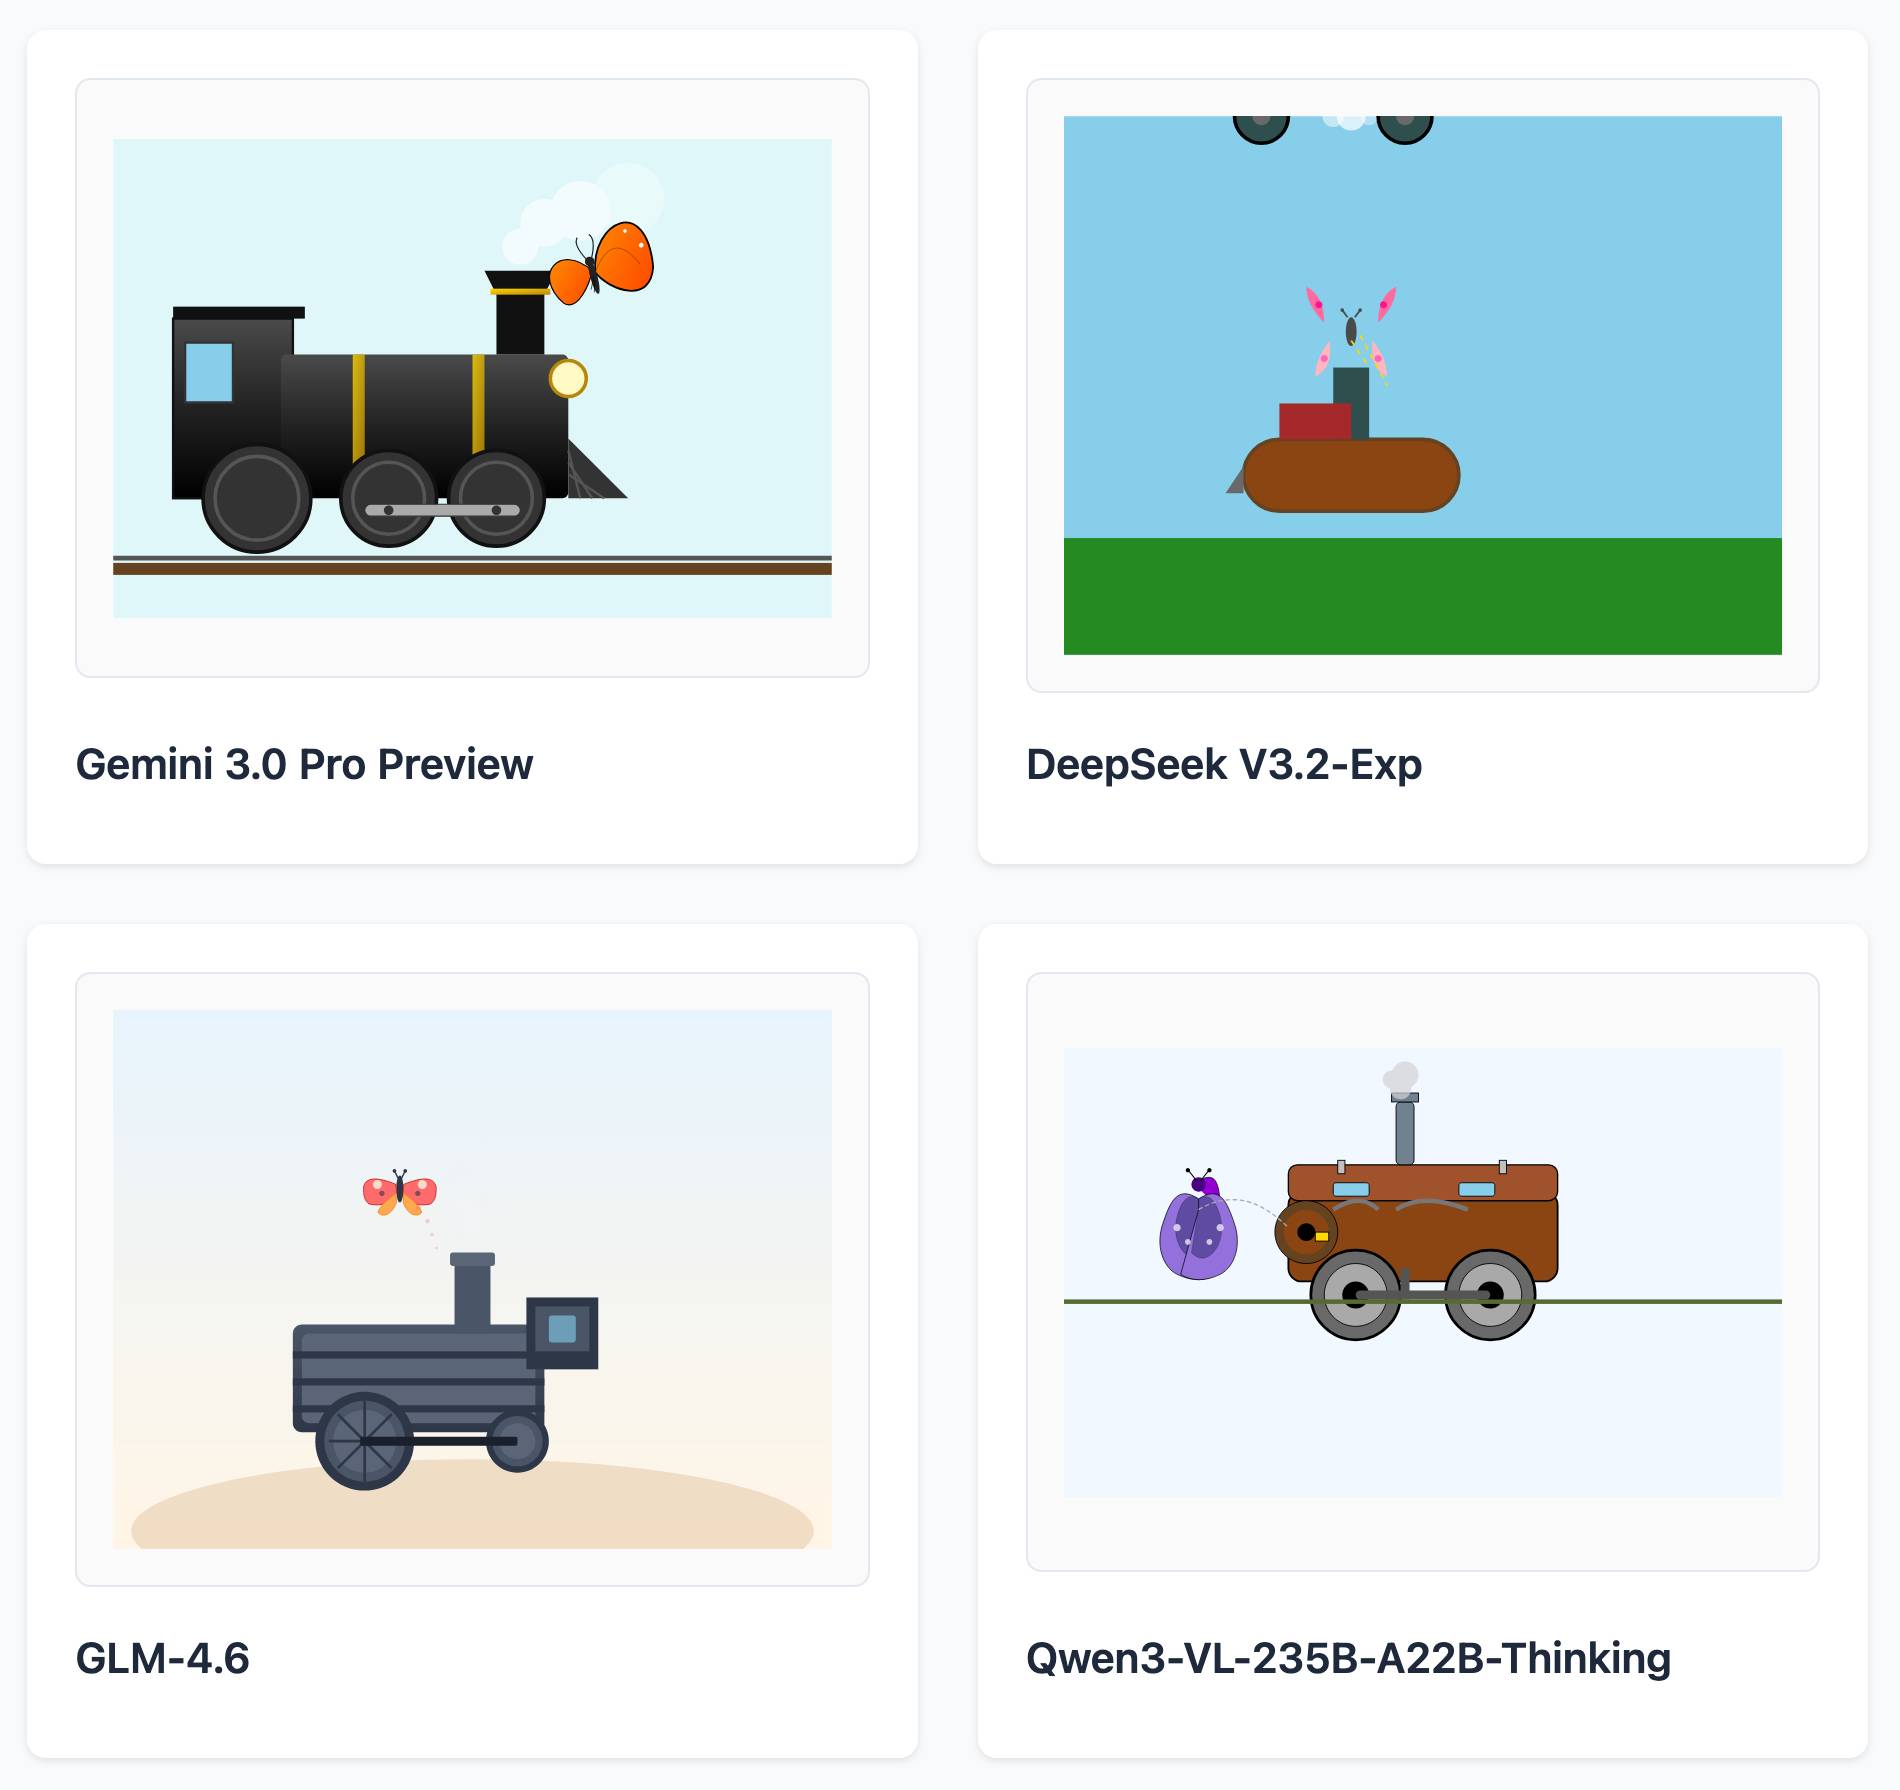
Here's a delightful project by Tom Gally, inspired by my pelican SVG benchmark. He asked Claude to help create more prompts of the form Generate an SVG of [A] [doing] [B] and then ran 30 creative prompts against 9 frontier models - prompts like "an octopus operating a pipe organ" or "a starfish driving a bulldozer".
Here are some for "butterfly inspecting a steam engine":
And for "sloth steering an excavator":
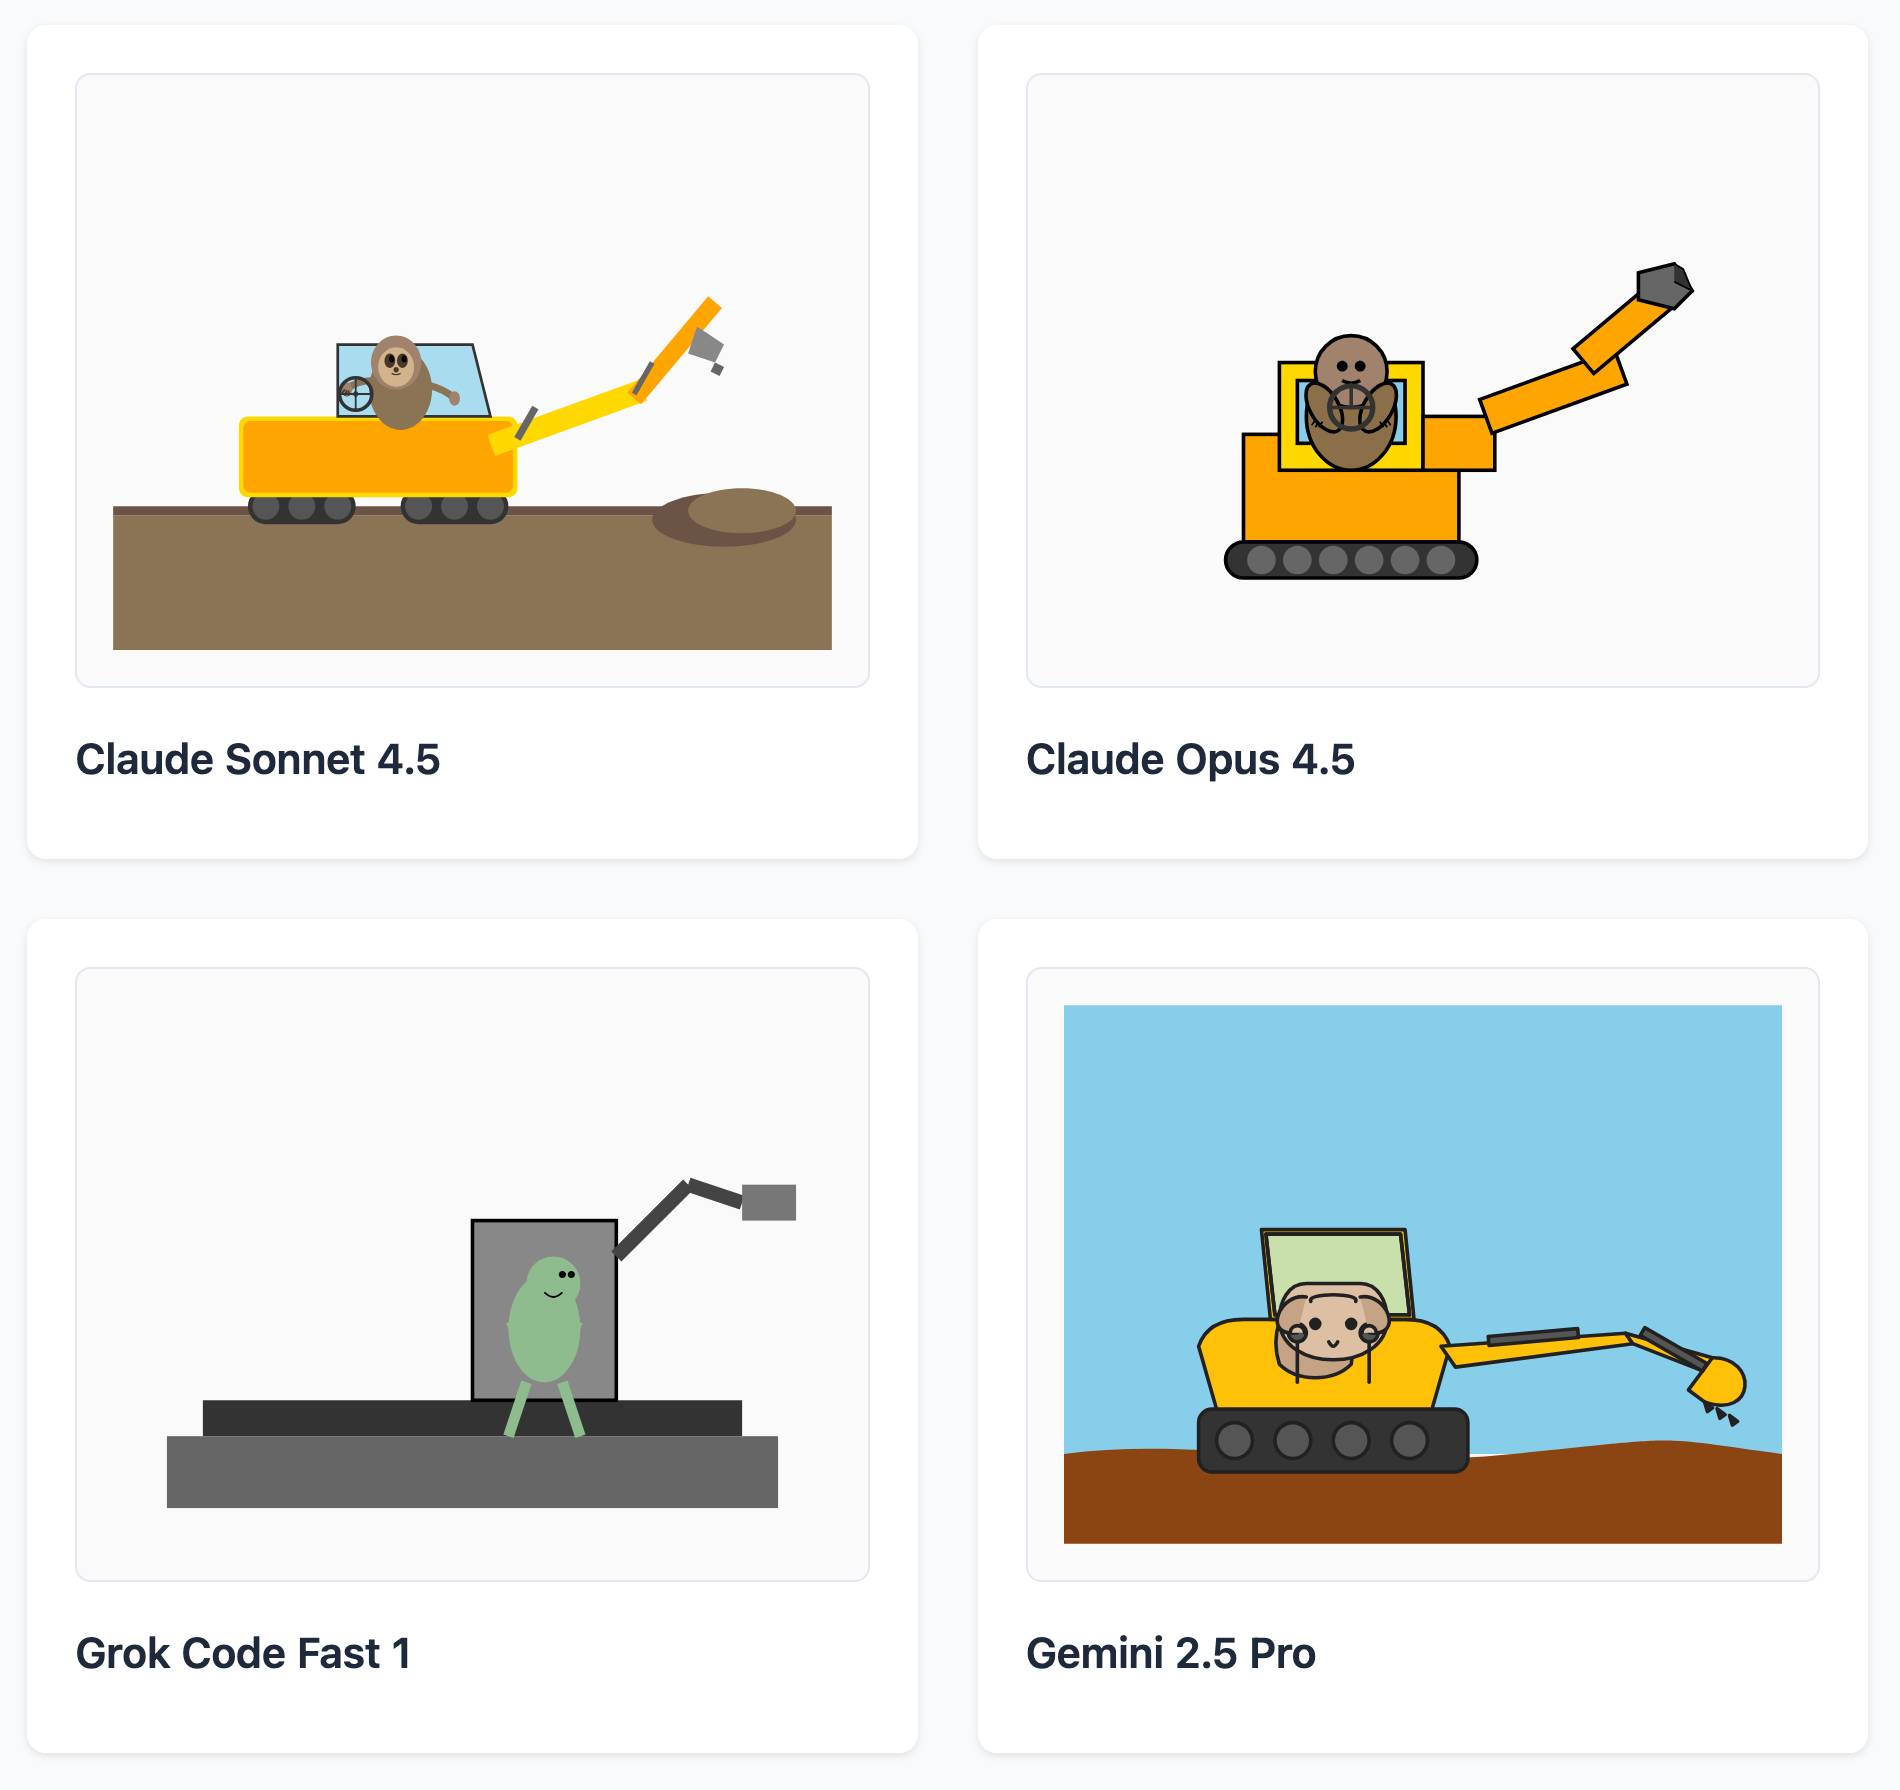
It's worth browsing the whole collection, which gives a really good overall indication of which models are the best at SVG art.
python-build-standalone now has Python 3.14.0a5. Exciting news from Charlie Marsh:
We just shipped the latest Python 3.14 alpha (3.14.0a5) to uv and python-build-standalone. This is the first release that includes the tail-calling interpreter.
Our initial benchmarks show a ~20-30% performance improvement across CPython.
This is an optimization that was first discussed in faster-cpython in January 2024, then landed earlier this month by Ken Jin and included in the 3.14a05 release. The alpha release notes say:
A new type of interpreter based on tail calls has been added to CPython. For certain newer compilers, this interpreter provides significantly better performance. Preliminary numbers on our machines suggest anywhere from -3% to 30% faster Python code, and a geometric mean of 9-15% faster on pyperformance depending on platform and architecture. The baseline is Python 3.14 built with Clang 19 without this new interpreter.
This interpreter currently only works with Clang 19 and newer on x86-64 and AArch64 architectures. However, we expect that a future release of GCC will support this as well.
Including this in python-build-standalone means it's now trivial to try out via uv. I upgraded to the latest uv like this:
pip install -U uvThen ran uv python list to see the available versions:
cpython-3.14.0a5+freethreaded-macos-aarch64-none    <download available>
cpython-3.14.0a5-macos-aarch64-none                 <download available>
cpython-3.13.2+freethreaded-macos-aarch64-none      <download available>
cpython-3.13.2-macos-aarch64-none                   <download available>
cpython-3.13.1-macos-aarch64-none                   /opt/homebrew/opt/python@3.13/bin/python3.13 -> ../Frameworks/Python.framework/Versions/3.13/bin/python3.13
I downloaded the new alpha like this:
uv python install cpython-3.14.0a5And tried it out like so:
uv run --python 3.14.0a5 pythonThe Astral team have been using Ken's bm_pystones.py benchmarks script. I grabbed a copy like this:
wget 'https://gist.githubusercontent.com/Fidget-Spinner/e7bf204bf605680b0fc1540fe3777acf/raw/fa85c0f3464021a683245f075505860db5e8ba6b/bm_pystones.py'And ran it with uv:
uv run --python 3.14.0a5 bm_pystones.pyGiving:
Pystone(1.1) time for 50000 passes = 0.0511138
This machine benchmarks at 978209 pystones/second
Inspired by Charlie's example I decided to try the hyperfine benchmarking tool, which can run multiple commands to statistically compare their performance. I came up with this recipe:
brew install hyperfine
hyperfine \
  "uv run --python 3.14.0a5 bm_pystones.py" \
  "uv run --python 3.13 bm_pystones.py" \
  -n tail-calling \
  -n baseline \
--warmup 10![Running that command produced: Benchmark 1: tail-calling Time (mean ± σ): 71.5 ms ± 0.9 ms [User: 65.3 ms, System: 5.0 ms] Range (min … max): 69.7 ms … 73.1 ms 40 runs Benchmark 2: baseline Time (mean ± σ): 79.7 ms ± 0.9 ms [User: 73.9 ms, System: 4.5 ms] Range (min … max): 78.5 ms … 82.3 ms 36 runs Summary tail-calling ran 1.12 ± 0.02 times faster than baseline](https://static.simonwillison.net/static/2025/hyperfine-uv.jpg)
So 3.14.0a5 scored 1.12 times faster than 3.13 on the benchmark (on my extremely overloaded M2 MacBook Pro).
2024
Speedometer 3.0: The Best Way Yet to Measure Browser Performance. The new browser performance testing suite, released as a collaboration between Blink, Gecko, and WebKit. It’s fun to run this in your browser and watch it rattle through 580 tests written using a wide variety of modern JavaScript frameworks and visualization libraries.
2010
The Web Server Benchmarking We Need. Ian Bicking asks for a WSGI benchmark which emphasises error handling over raw performance—can the server keep serving requests if some of them are CPU bound, I/O bound, wedged or cause a segfault?
Dojo 1.4.1 vs jQuery 1.4.2pre on Taskspeed. John Resig’s reponse. When JavaScript libraries compete on performance, everybody wins.
Dojo: Still Twice As Fast When It Matters Most. Alex Russell shows how Dojo out-performs jQuery on the TaskSpeed benchmark, which attempts to represent common tasks in real-world applications and has had code that have been optimised by the development teams behind each of the libraries.
2009
Socket Benchmark of Asynchronous Servers in Python. A comparison of eight different asynchronous networking frameworks in Python. Tornado comes out on top in most of the benchmarks, but the post is most interesting for the direct comparison of simple code examples for each of the frameworks.
JSLitmus. “A lightweight tool for creating ad-hoc JavaScript benchmark tests”. Includes an ingenious hack for graphing the results—it generates a Google Chart, then provides a TinyURL for viewing that chart in the future. The TinyURL is generated by pointing an inconspicuous iframe at the TinyURL API and letting the user copy-and-paste the resulting shortened URL directly out of the iframe.
2008
Dromaeo: JavaScript Performance Testing (via) This is one classy benchmark. Run it in as many browsers as you like (each run is saved to the server and assigned a run ID), then compare the results by appending ?id=[run1],[run2]... to the URL.
20,000 Reasons Why Comet Scales. Greg Wilkins coaxes Jetty and Bayeux in to supporting 20,000 simultaneous users per server while maintaining sub-second latency, using Amazon EC2 to run the benchmark.
2007
PostgreSQL 8.3 vs. 8.2—a simple benchmark. Stefan Kaltenbrunner reports a 2.2x speed increase for PostgreSQL 8.3 compared to 8.2 for a relatively simple benchmark.
ErlyWeb vs. Ruby on Rails EC2 Performance Showdown. ErlyWeb’s peak response rate beats Rails by 47x, albeit with a hugely simplified benchmark. More interesting than the results is the idea of using EC2 for benchmarking on identical simulated hardware.
Some Notes on Tim Bray’s Wide Finder Benchmark. Fredrik Lundh demonstrates some Python ninja techniques for parsing log files using multiple cores (and eventually memory mapping).