82 posts tagged “geospatial”
2026
Coding agents for data analysis. Here's the handout I prepared for my NICAR 2026 workshop "Coding agents for data analysis" - a three hour session aimed at data journalists demonstrating ways that tools like Claude Code and OpenAI Codex can be used to explore, analyze and clean data.
Here's the table of contents:
I ran the workshop using GitHub Codespaces and OpenAI Codex, since it was easy (and inexpensive) to distribute a budget-restricted API key for Codex that attendees could use during the class. Participants ended up burning $23 of Codex tokens.
The exercises all used Python and SQLite and some of them used Datasette.
One highlight of the workshop was when we started running Datasette such that it served static content from a viz/ folder, then had Claude Code start vibe coding new interactive visualizations directly in that folder. Here's a heat map it created for my trees database using Leaflet and Leaflet.heat, source code here.

I designed the handout to also be useful for people who weren't able to attend the session in person. As is usually the case, material aimed at data journalists is equally applicable to anyone else with data to explore.
2025
Let the LLM Write the Prompts: An Intro to DSPy in Compound Al Pipelines. I've had trouble getting my head around DSPy in the past. This half hour talk by Drew Breunig at the recent Databricks Data + AI Summit is the clearest explanation I've seen yet of the kinds of problems it can help solve.
Here's Drew's written version of the talk.
Drew works on Overture Maps, which combines Point Of Interest data from numerous providers to create a single unified POI database. This is an example of conflation, a notoriously difficult task in GIS where multiple datasets are deduped and merged together.
Drew uses an inexpensive local model, Qwen3-0.6B, to compare 70 million addresses and identity matches, for example between Place(address="3359 FOOTHILL BLVD", name="RESTAURANT LOS ARCOS") and Place(address="3359 FOOTHILL BLVD", name="Los Arcos Taqueria"').
DSPy's role is to optimize the prompt used for that smaller model. Drew used GPT-4.1 and the dspy.MIPROv2 optimizer, producing a 700 token prompt that increased the score from 60.7% to 82%.
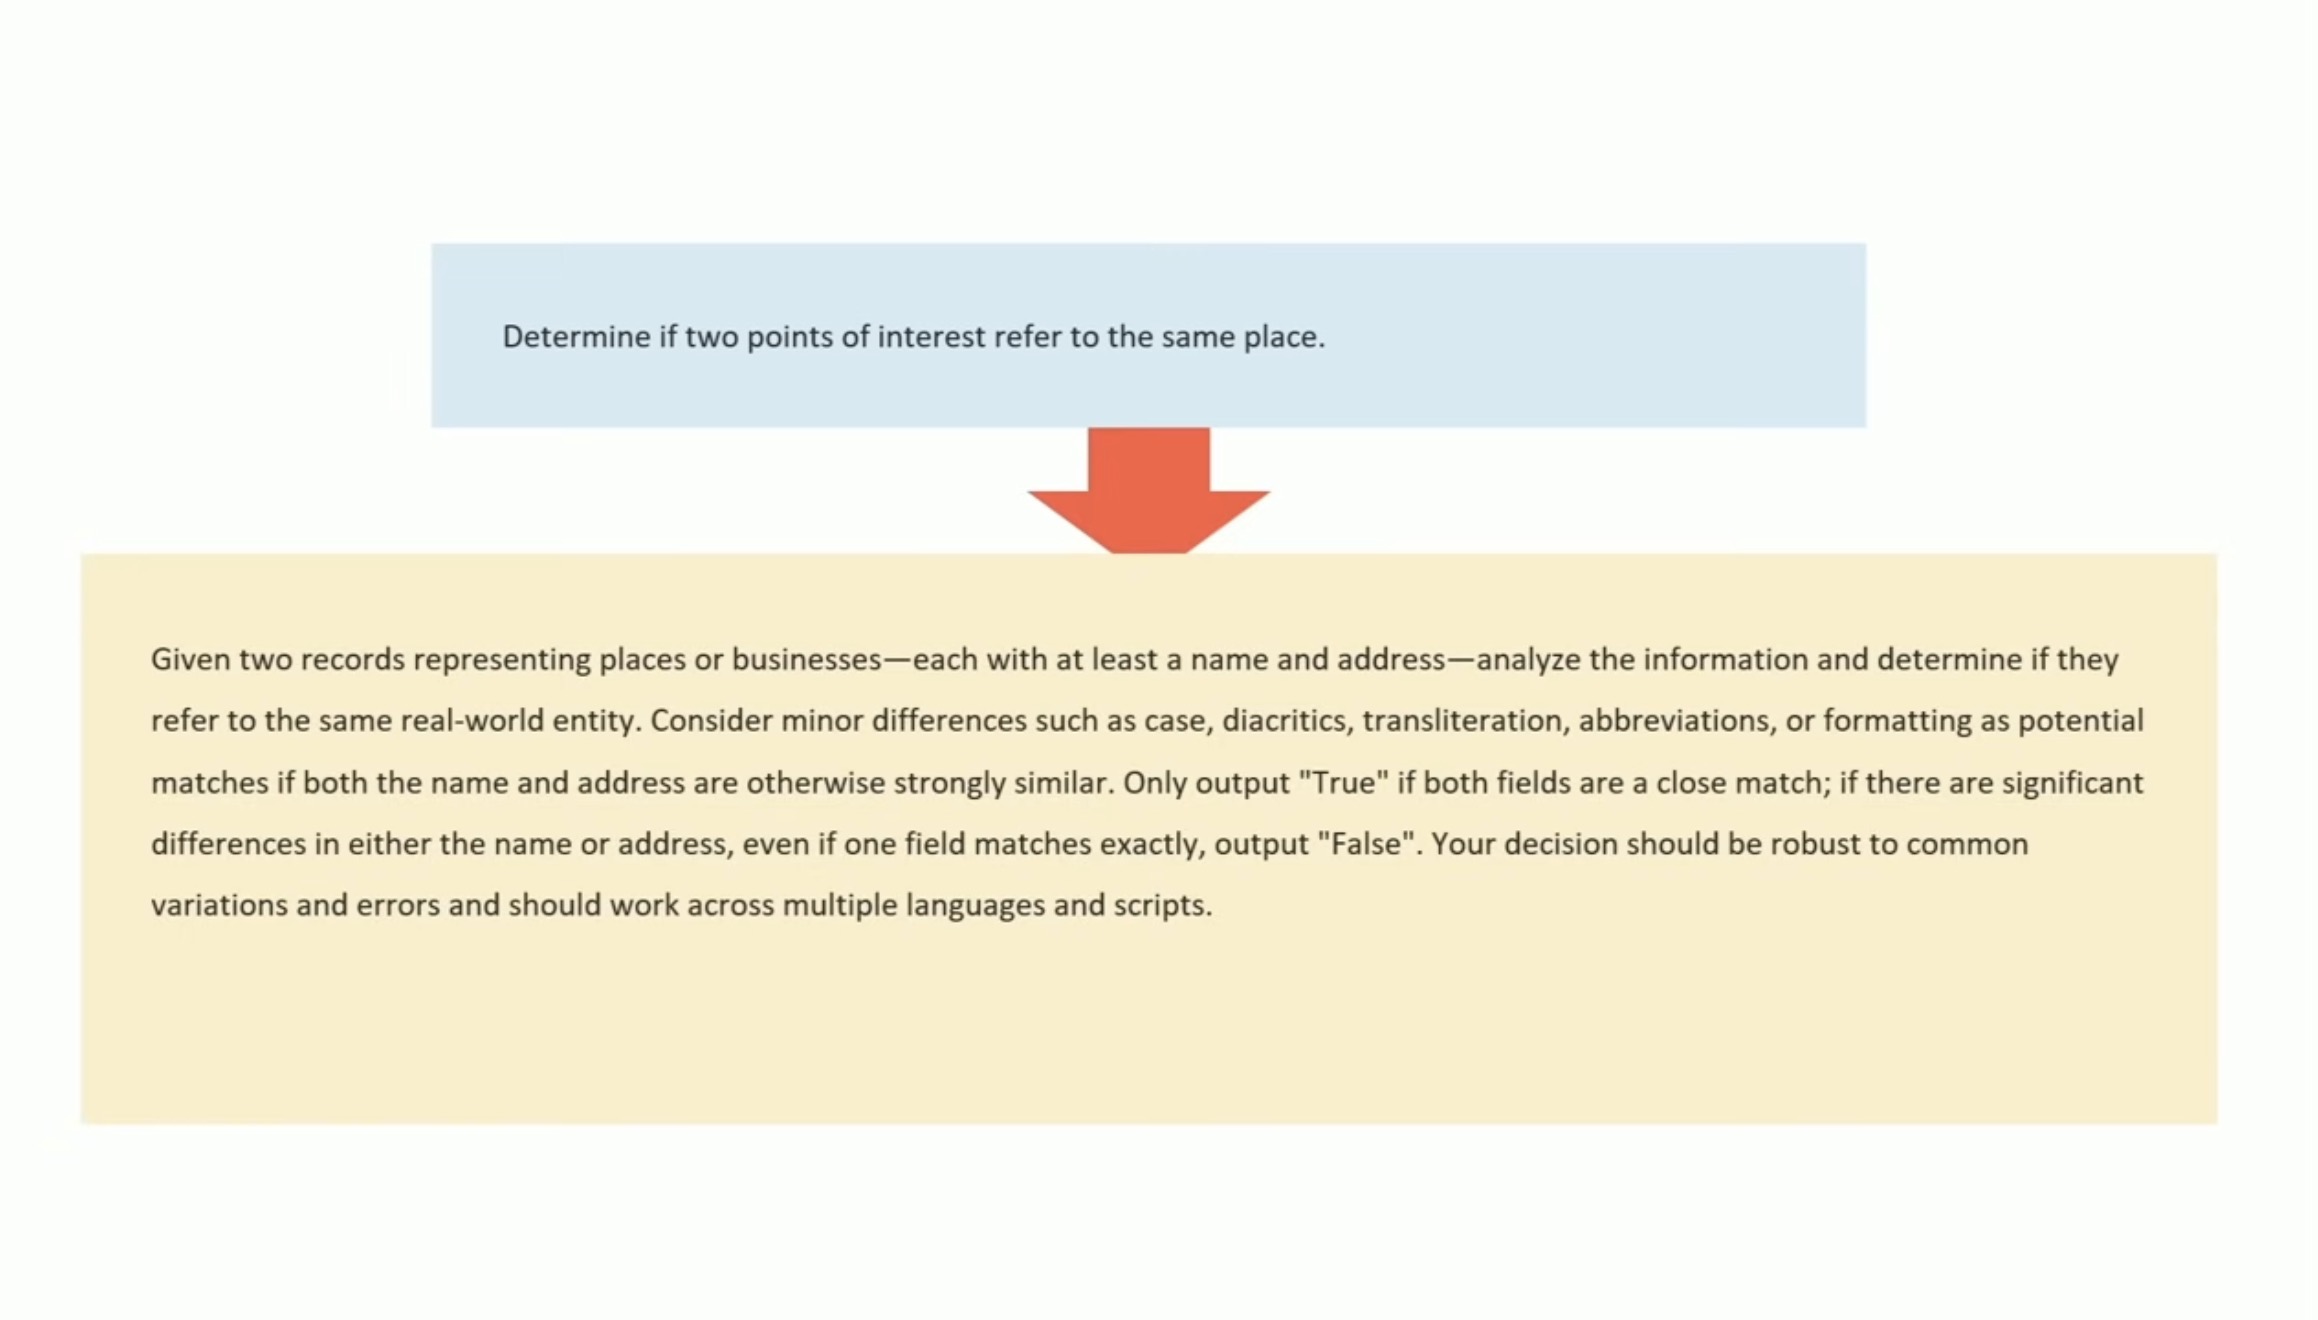
Why bother? Drew points out that having a prompt optimization pipeline makes it trivial to evaluate and switch to other models if they can score higher with a custom optimized prompt - without needing to execute that trial-and-error optimization by hand.
Spatial Joins in DuckDB (via) Extremely detailed overview by Max Gabrielsson of DuckDB's new spatial join optimizations.
Consider the following query, which counts the number of NYC Citi Bike Trips for each of the neighborhoods defined by the NYC Neighborhood Tabulation Areas polygons and returns the top three:
SELECT neighborhood,
  count(*) AS num_rides
FROM rides
JOIN hoods ON ST_Intersects(
  rides.start_geom, hoods.geom
)
GROUP BY neighborhood
ORDER BY num_rides DESC
LIMIT 3;
The rides table contains 58,033,724 rows. The hoods table has polygons for 310 neighborhoods.
Without an optimized spatial joins this query requires a nested loop join, executing that expensive ST_Intersects() operation 58m * 310 ~= 18 billion times. This took around 30 minutes on the 36GB MacBook M3 Pro used for the benchmark.
The first optimization described - implemented from DuckDB 1.2.0 onwards - uses a "piecewise merge join". This takes advantage of the fact that a bounding box intersection is a whole lot faster to calculate, especially if you pre-cache the bounding box (aka the minimum bounding rectangle or MBR) in the stored binary GEOMETRY representation.
Rewriting the query to use a fast bounding box intersection and then only running the more expensive ST_Intersects() filters on those matches drops the runtime from 1800 seconds to 107 seconds.
The second optimization, added in DuckDB 1.3.0 in May 2025 using the new SPATIAL_JOIN operator, is significantly more sophisticated.
DuckDB can now identify when a spatial join is working against large volumes of data and automatically build an in-memory R-Tree of bounding boxes for the larger of the two tables being joined.
This new R-Tree further accelerates the bounding box intersection part of the join, and drops the runtime down to just 30 seconds.
I counted all of the yurts in Mongolia using machine learning (via) Fascinating, detailed account by Monroe Clinton of a geospatial machine learning project. Monroe wanted to count visible yurts in Mongolia using Google Maps satellite view. The resulting project incorporates mercantile for tile calculations, Label Studio for help label the first 10,000 examples, a model trained on top of YOLO11 and a bunch of clever custom Python code to co-ordinate a brute force search across 120 CPU workers running the model.
DuckDB is Probably the Most Important Geospatial Software of the Last Decade. Drew Breunig argues that the ease of installation of DuckDB is opening up geospatial analysis to a whole new set of developers.
This inspired a comment on Hacker News from DuckDB Labs geospatial engineer Max Gabrielsson which helps explain why the drop in friction introduced by DuckDB is so significant:
I think a big part is that duckdbs spatial extension provides a SQL interface to a whole suite of standard foss gis packages by statically bundling everything (including inlining the default PROJ database of coordinate projection systems into the binary) and providing it for multiple platforms (including WASM). I.E there are no transitive dependencies except libc.
[...] the fact that you can e.g. convert too and from a myriad of different geospatial formats by utilizing GDAL, transforming through SQL, or pulling down the latest overture dump without having the whole workflow break just cause you updated QGIS has probably been the main killer feature for a lot of the early adopters.
I've lost count of the time I've spent fiddling with dependencies like GDAL trying to get various geospatial tools to work in the past. Bundling difficult dependencies statically is an under-appreciated trick!
If the bold claim in the headline inspires you to provide a counter-example, bear in mind that a decade ago is 2015, and most of the key technologies In the modern geospatial stack - QGIS, PostGIS, geopandas, SpatiaLite - predate that by quite a bit.
My post on o3 guessing locations from photos made it to Hacker News and by far the most interesting comments are from SamPatt, a self-described competitive GeoGuessr player.
In a thread about meta-knowledge of the StreetView card uses in different regions:
The photography matters a great deal - they're categorized into "Generations" of coverage. Gen 2 is low resolution, Gen 3 is pretty good but has a distinct car blur, Gen 4 is highest quality. Each country tends to have only one or two categories of coverage, and some are so distinct you can immediately know a location based solely on that (India is the best example here). [...]
Nigeria and Tunisia have follow cars. Senegal, Montenegro and Albania have large rifts in the sky where the panorama stitching software did a poor job. Some parts of Russia had recent forest fires and are very smokey. One road in Turkey is in absurdly thick fog. The list is endless, which is why it's so fun!
Sam also has his own custom Obsidian flashcard deck "with hundreds of entries to help me remember road lines, power poles, bollards, architecture, license plates, etc".
I asked Sam how closely the GeoGuessr community track updates to street view imagery, and unsurprisingly those are a big deal. Sam pointed me to this 10 minute video review by zi8gzag of the latest big update from three weeks ago:
This is one of the biggest updates in years in my opinion. It could be the biggest update since the 2022 update that gave Gen 4 to Nigeria, Senegal, and Rwanda. It's definitely on the same level as the Kazakhstan update or the Germany update in my opinion.
A5 (via) A5 is a new "global, equal-area, millimeter-accurate geospatial index" by Felix Palmer:
It is the pentagonal equivalent of other DGGSs, like S2 or H3, but with higher accuracy and lower distortion.
Effectively it's a way of dividing the entire world into pentagons where each one covers the same physical area (to within a 2% threshold) - like Uber's H3 but a bit weirder and more fun. An A5 reference implementation written in TypeScript is available on GitHub.
This interactive demo helps show how it works:

Why pentagons? Here's what the A5 docs say:
A5 is unique in that it uses a pentagonal tiling of a dodecahedron. [...] The benefit of choosing a dodecahedron is that it is the platonic solid with the lowest vertex curvature, and by this measure it is the most spherical of all the platonic solids. This is key for minimizing cell distortion as the process of projecting a platonic solid onto a sphere involves warping the cell geometry to force the vertex curvature to approach zero. Thus, the lower the original vertex curvature, the less distortion will be introduced by the projection.
I had to look up platonic solids on Wikipedia. There are only five: Tetrahedron, Cube, Octahedron, Dodecahedron and Icosahedron and they can be made using squares, triangles or (in the case of the Dodecahedron) pentagons, making the pentagon the most circle-like option.
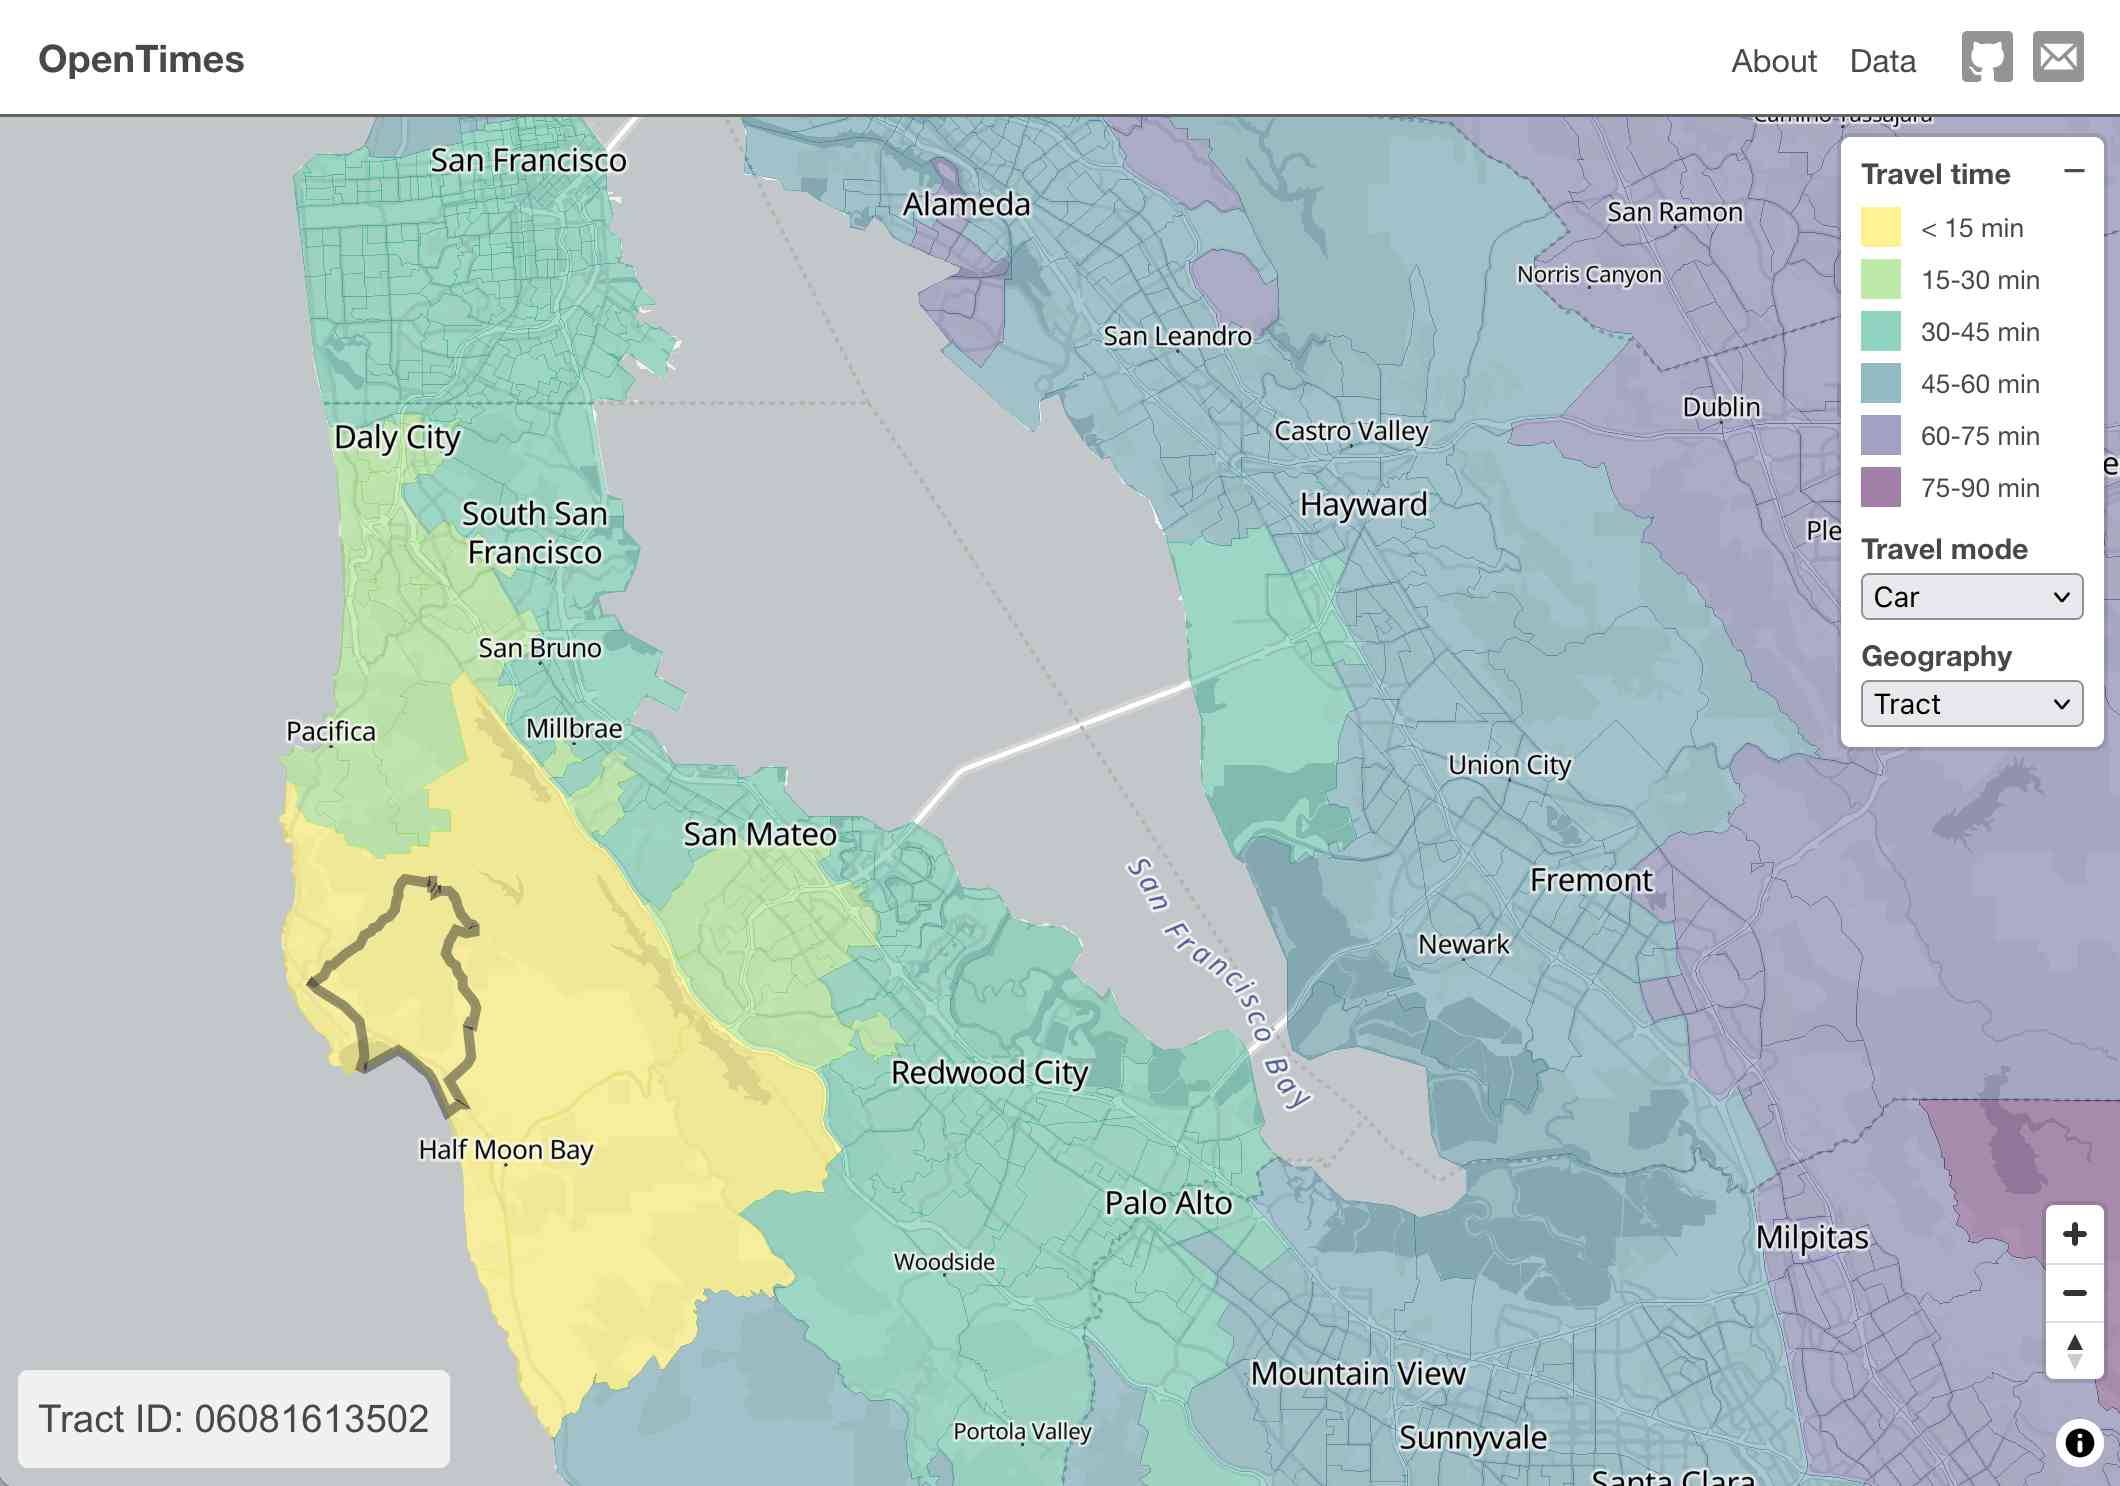
OpenTimes (via) Spectacular new open geospatial project by Dan Snow:
OpenTimes is a database of pre-computed, point-to-point travel times between United States Census geographies. It lets you download bulk travel time data for free and with no limits.
Here's what I get for travel times by car from El Granada, California:
The technical details are fascinating:
- The entire OpenTimes backend is just static Parquet files on Cloudflare's R2. There's no RDBMS or running service, just files and a CDN. The whole thing costs about $10/month to host and costs nothing to serve. In my opinion, this is a great way to serve infrequently updated, large public datasets at low cost (as long as you partition the files correctly).
Sure enough, R2 pricing charges "based on the total volume of data stored" - $0.015 / GB-month for standard storage, then $0.36 / million requests for "Class B" operations which include reads. They charge nothing for outbound bandwidth.
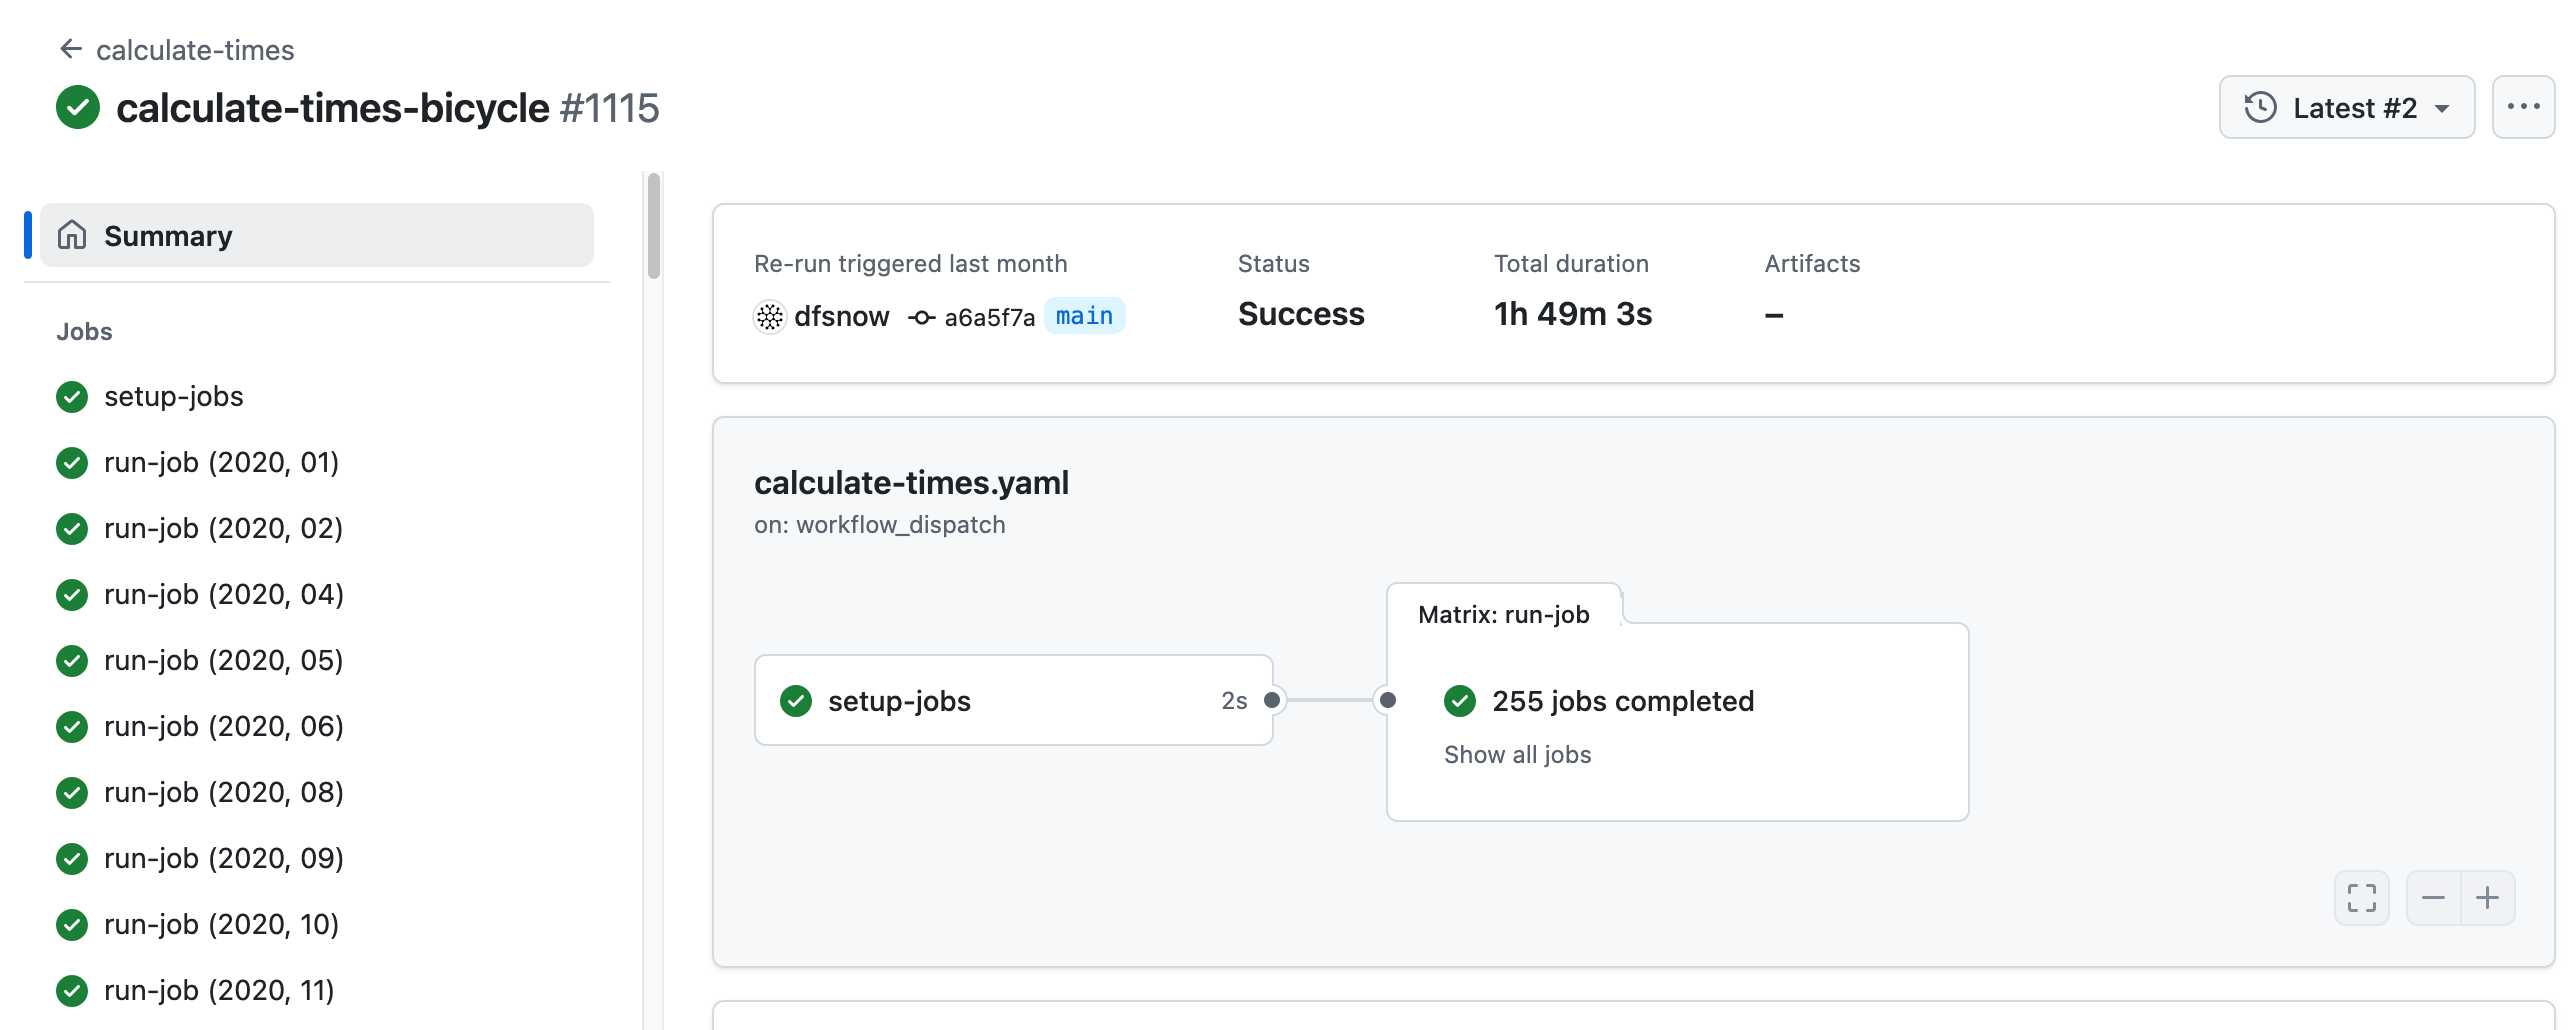
- All travel times were calculated by pre-building the inputs (OSM, OSRM networks) and then distributing the compute over hundreds of GitHub Actions jobs. This worked shockingly well for this specific workload (and was also completely free).
Here's a GitHub Actions run of the calculate-times.yaml workflow which uses a matrix to run 255 jobs!
Relevant YAML:
  matrix:
    year: ${{ fromJSON(needs.setup-jobs.outputs.years) }}
    state: ${{ fromJSON(needs.setup-jobs.outputs.states) }}
Where those JSON files were created by the previous step, which reads in the year and state values from this params.yaml file.
- The query layer uses a single DuckDB database file with views that point to static Parquet files via HTTP. This lets you query a table with hundreds of billions of records after downloading just the ~5MB pointer file.
This is a really creative use of DuckDB's feature that lets you run queries against large data from a laptop using HTTP range queries to avoid downloading the whole thing.
The README shows how to use that from R and Python - I got this working in the duckdb client (brew install duckdb):
INSTALL httpfs;
LOAD httpfs;
ATTACH 'https://data.opentimes.org/databases/0.0.1.duckdb' AS opentimes;

SELECT origin_id, destination_id, duration_sec
  FROM opentimes.public.times
  WHERE version = '0.0.1'
      AND mode = 'car'
      AND year = '2024'
      AND geography = 'tract'
      AND state = '17'
      AND origin_id LIKE '17031%' limit 10;
In answer to a question about adding public transit times Dan said:
In the next year or so maybe. The biggest obstacles to adding public transit are:
- Collecting all the necessary scheduling data (e.g. GTFS feeds) for every transit system in the county. Not insurmountable since there are services that do this currently.
- Finding a routing engine that can compute nation-scale travel time matrices quickly. Currently, the two fastest open-source engines I've tried (OSRM and Valhalla) don't support public transit for matrix calculations and the engines that do support public transit (R5, OpenTripPlanner, etc.) are too slow.
GTFS is a popular CSV-based format for sharing transit schedules - here's an official list of available feed directories.
This whole project feels to me like a great example of the baked data architectural pattern in action.
wolf-h3-viewer.glitch.me (via) Neat interactive visualization of Uber's H3 hexagonal geographical indexing mechanism.
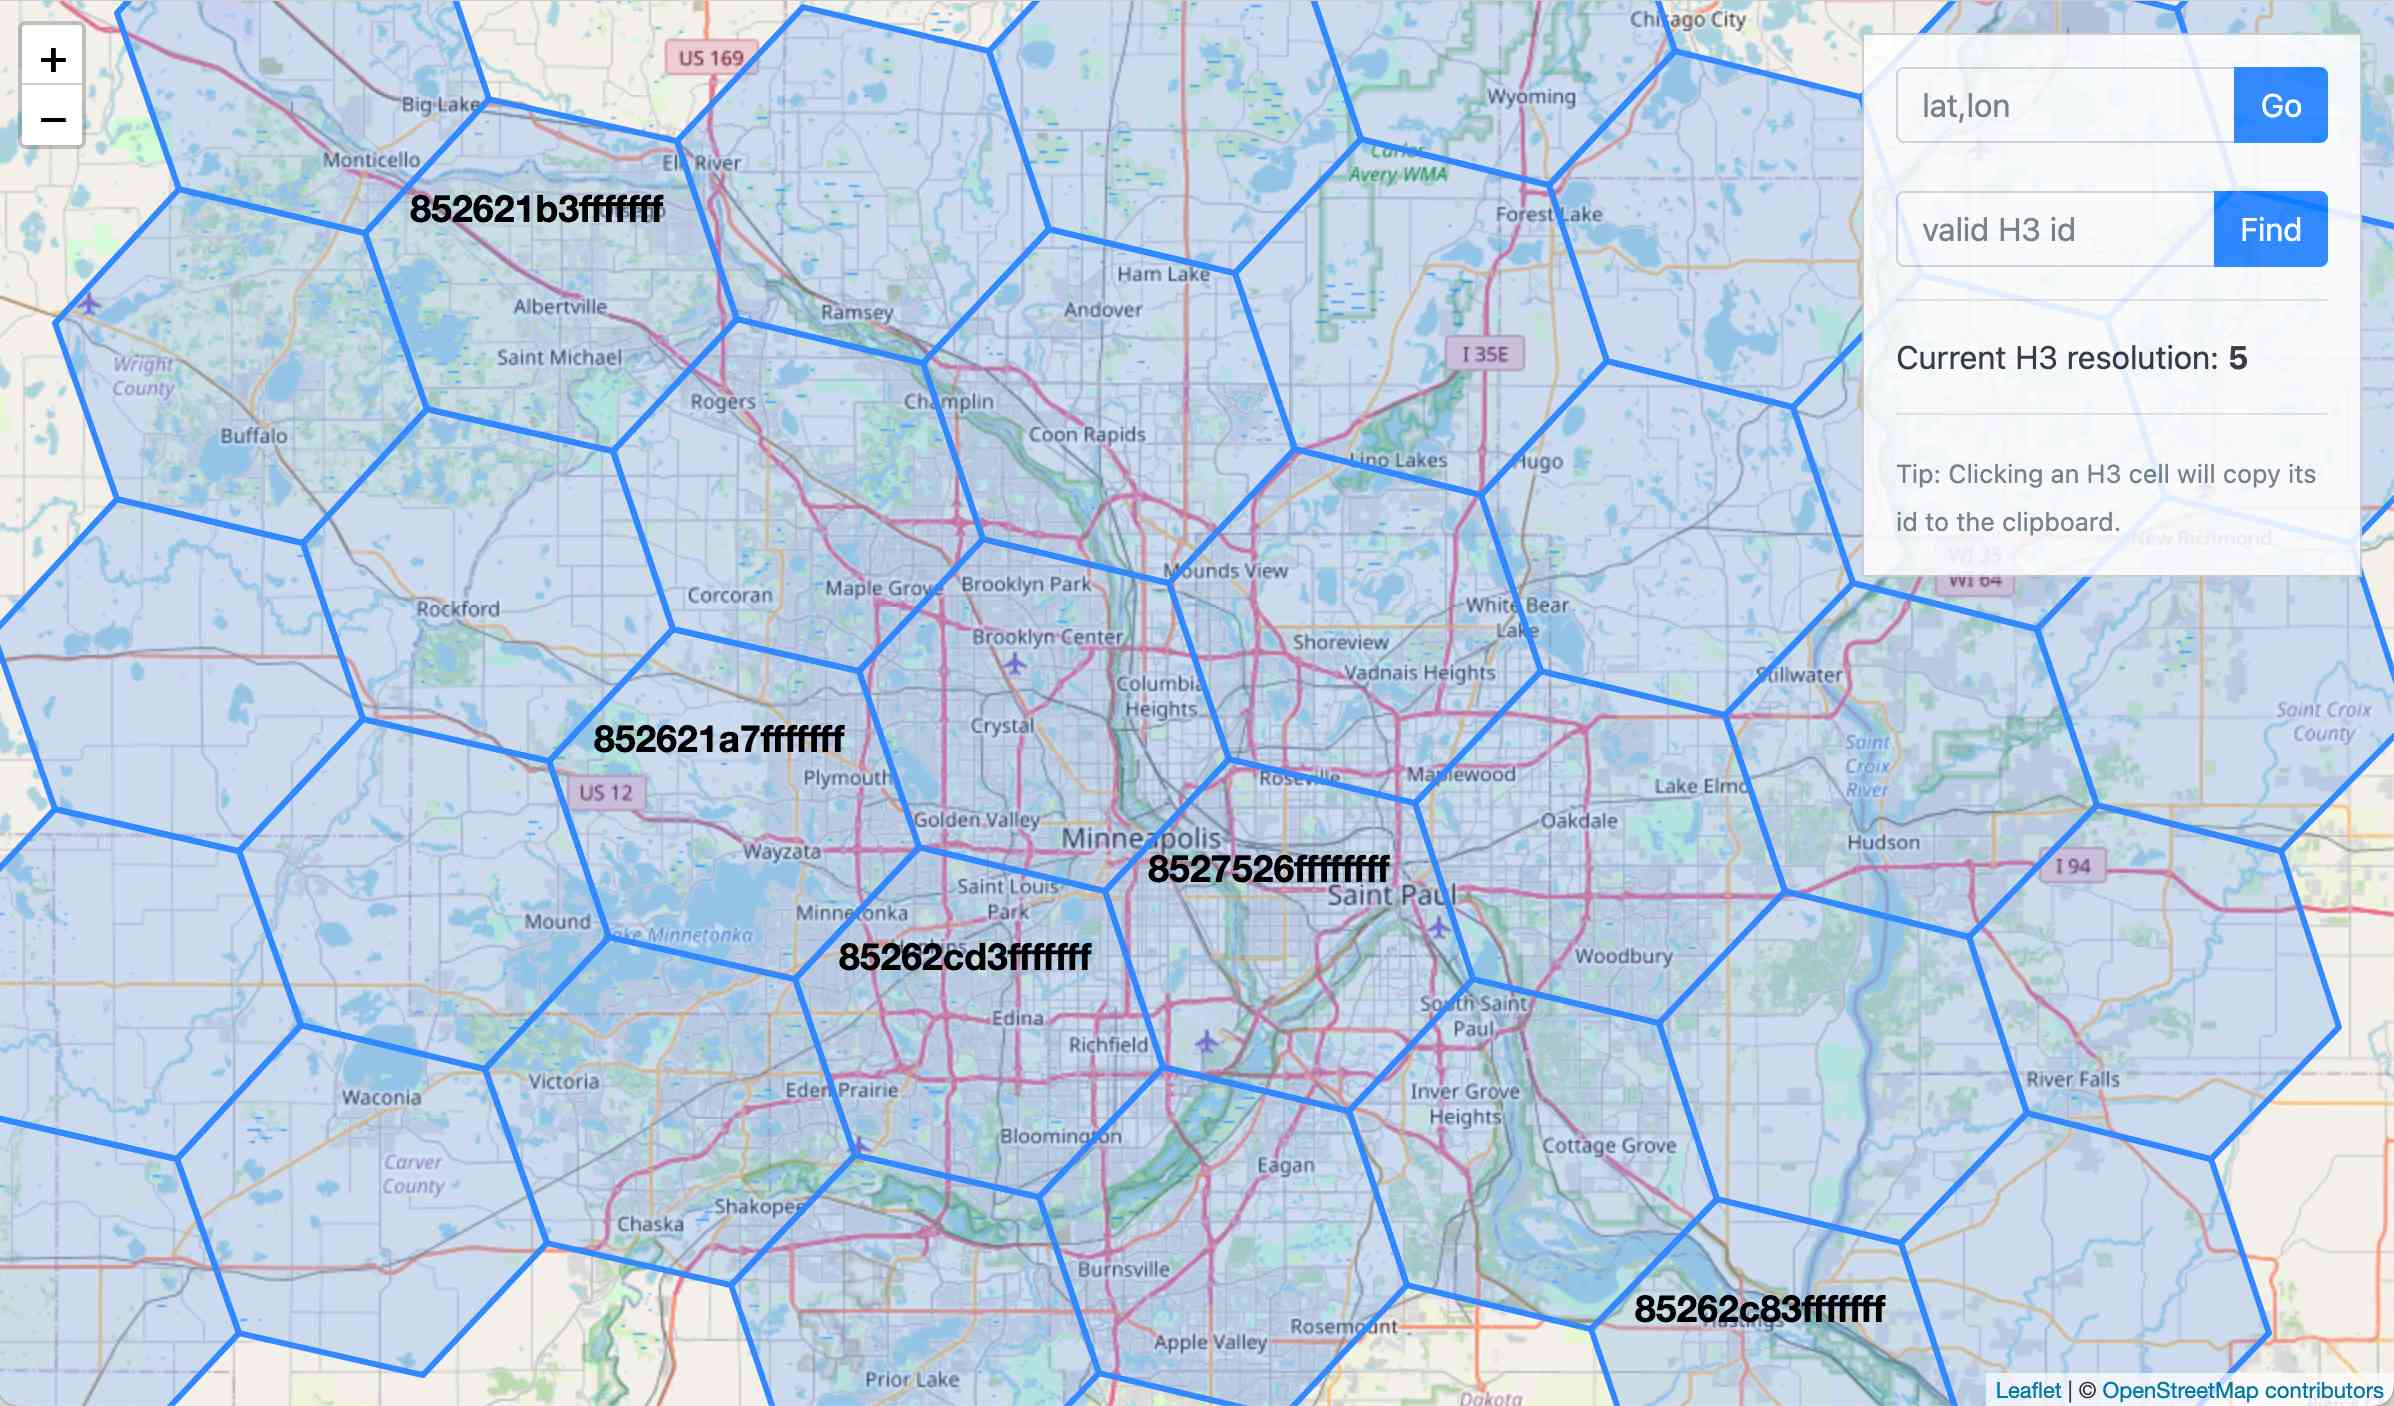
Here's the source code.
Why does H3 use hexagons? Because Hexagons are the Bestagons:
When hexagons come together, they form three-sided joints 120 degrees apart. This, for the least material, is the most mechanically stable arrangement.
Only triangles, squares, and hexagons can tile a plane without gaps, and of those three shapes hexagons offer the best ratio of perimeter to area.
2024
OpenStreetMap embed URL.
I just found out OpenStreetMap have a "share" button which produces HTML for an iframe targetting https://www.openstreetmap.org/export/embed.html, making it easy to drop an OpenStreetMap map onto any web page that allows iframes.
As far as I can tell the supported parameters are:
bbox=then min longitude, min latitude, max longitude, max latitudemarker=optional latitude, longitude coordinate for a marker (only a single marker is supported)layer=mapnik- other values I've found that work arecyclosm,cyclemap,transportmapandhot(for humanitarian)
Here's HTML for embedding this on a page using a sandboxed iframe - the allow-scripts is necessary for the map to display.
<iframe
sandbox="allow-scripts"
style="border: none; width: 100%; height: 20em;"
src="https://www.openstreetmap.org/export/embed.html?bbox=-122.613%2C37.431%2C-122.382%2C37.559&layer=mapnik&marker=37.495%2C-122.497"
></iframe>
Thanks to this post I learned that iframes are rendered correctly in NetNewsWire, NewsExplorer, NewsBlur and Feedly on Android.
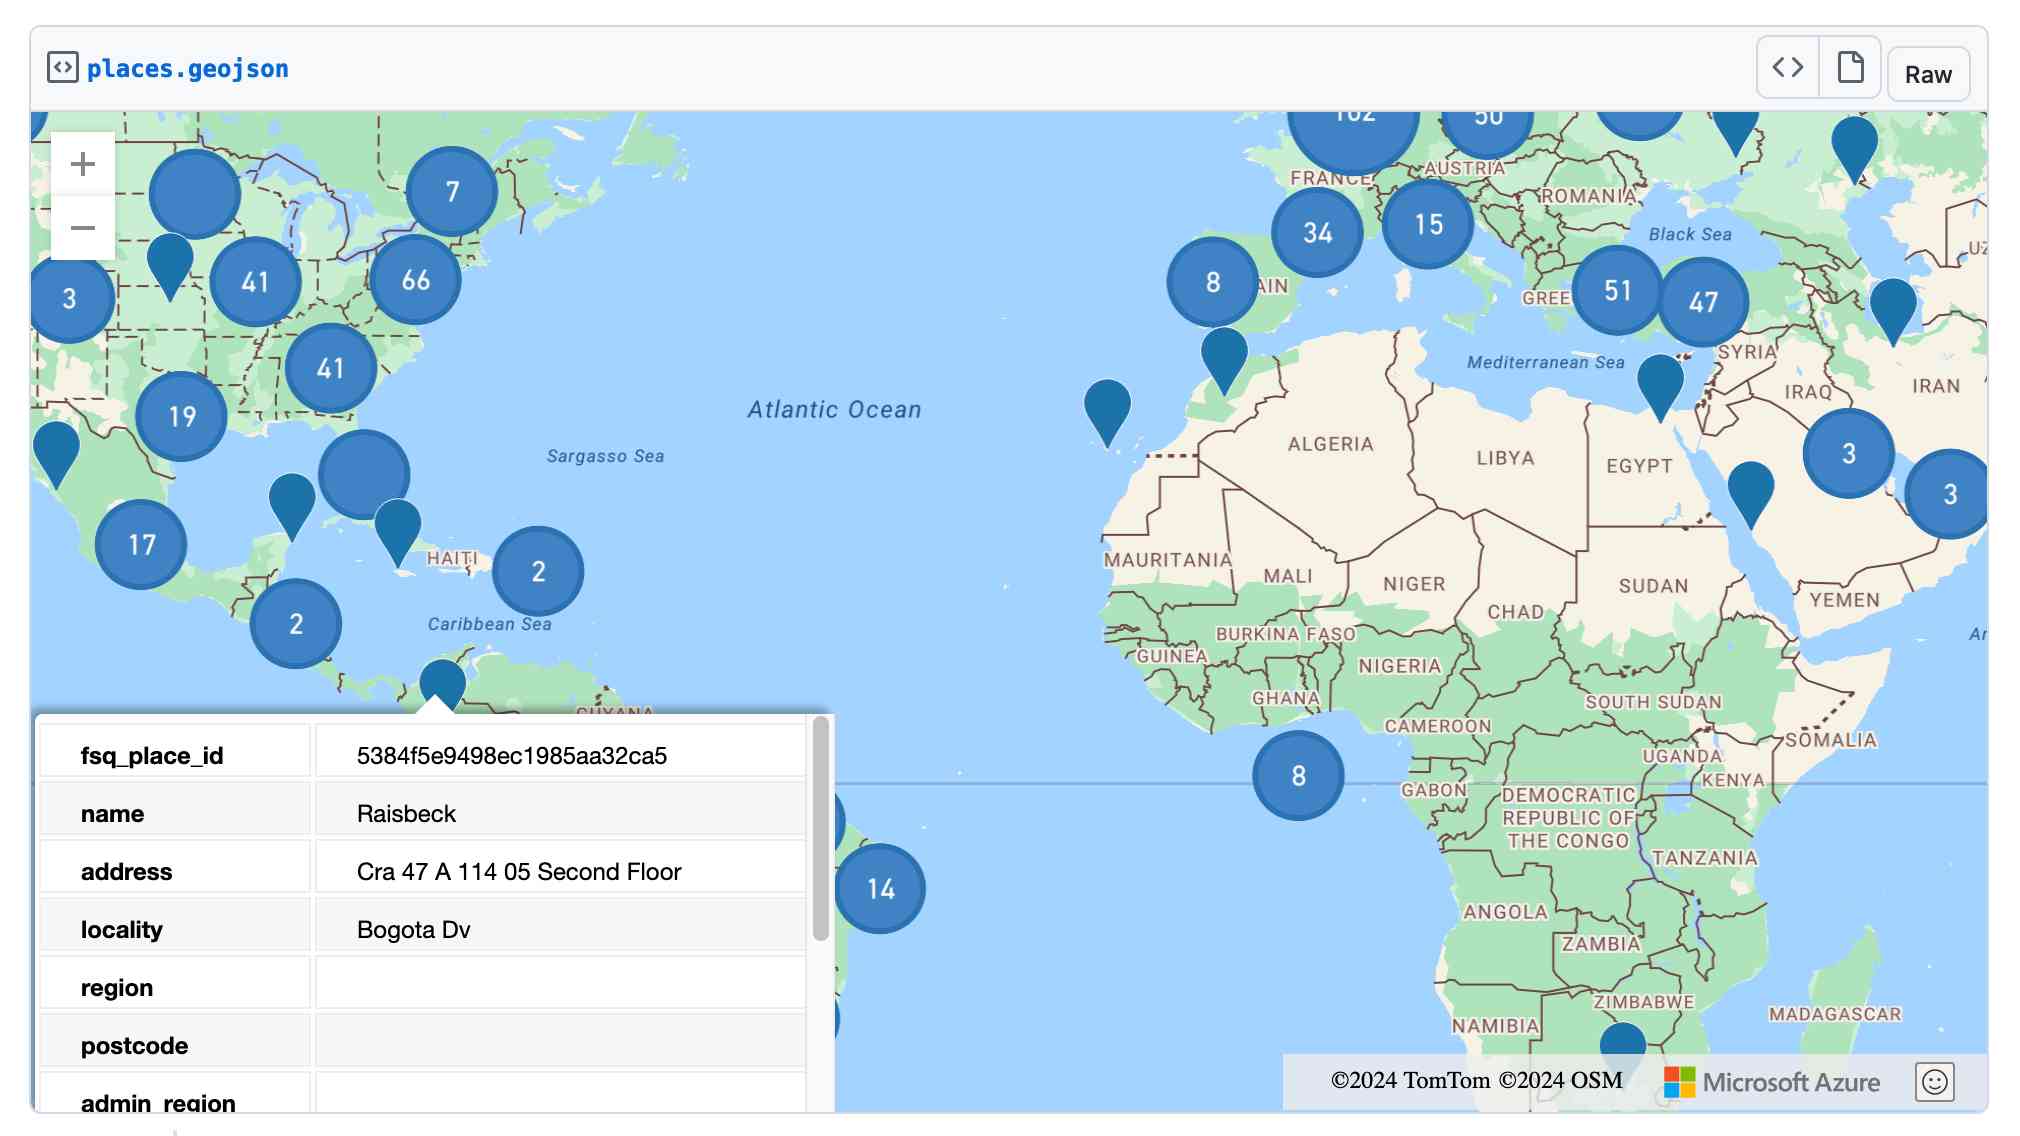
Foursquare Open Source Places: A new foundational dataset for the geospatial community (via) I did not expect this!
[...] we are announcing today the general availability of a foundational open data set, Foursquare Open Source Places ("FSQ OS Places"). This base layer of 100mm+ global places of interest ("POI") includes 22 core attributes (see schema here) that will be updated monthly and available for commercial use under the Apache 2.0 license framework.
The data is available as Parquet files hosted on Amazon S3.
Here's how to list the available files:
aws s3 ls s3://fsq-os-places-us-east-1/release/dt=2024-11-19/places/parquet/
I got back places-00000.snappy.parquet through places-00024.snappy.parquet, each file around 455MB for a total of 10.6GB of data.
I ran duckdb and then used DuckDB's ability to remotely query Parquet on S3 to explore the data a bit more without downloading it to my laptop first:
select count(*) from 's3://fsq-os-places-us-east-1/release/dt=2024-11-19/places/parquet/places-00000.snappy.parquet';
This got back 4,180,424 - that number is similar for each file, suggesting around 104,000,000 records total.
Update: DuckDB can use wildcards in S3 paths (thanks, Paul) so this query provides an exact count:
select count(*) from 's3://fsq-os-places-us-east-1/release/dt=2024-11-19/places/parquet/places-*.snappy.parquet';
That returned 104,511,073 - and Activity Monitor on my Mac confirmed that DuckDB only needed to fetch 1.2MB of data to answer that query.
I ran this query to retrieve 1,000 places from that first file as newline-delimited JSON:
copy (
    select * from 's3://fsq-os-places-us-east-1/release/dt=2024-11-19/places/parquet/places-00000.snappy.parquet'
    limit 1000
) to '/tmp/places.json';
Here's that places.json file, and here it is imported into Datasette Lite.
Finally, I got ChatGPT Code Interpreter to convert that file to GeoJSON and pasted the result into this Gist, giving me a map of those thousand places (because Gists automatically render GeoJSON):
OpenStreetMap vector tiles demo
(via)
Long-time OpenStreetMap developer Paul Norman has been working on adding vector tile support to OpenStreetMap for quite a while. Paul recently announced that vector.openstreetmap.org is now serving vector tiles (in Mapbox Vector Tiles (MVT) format) - here's his interactive demo for seeing what they look like.
Visualizing local election results with Datasette, Observable and MapLibre GL
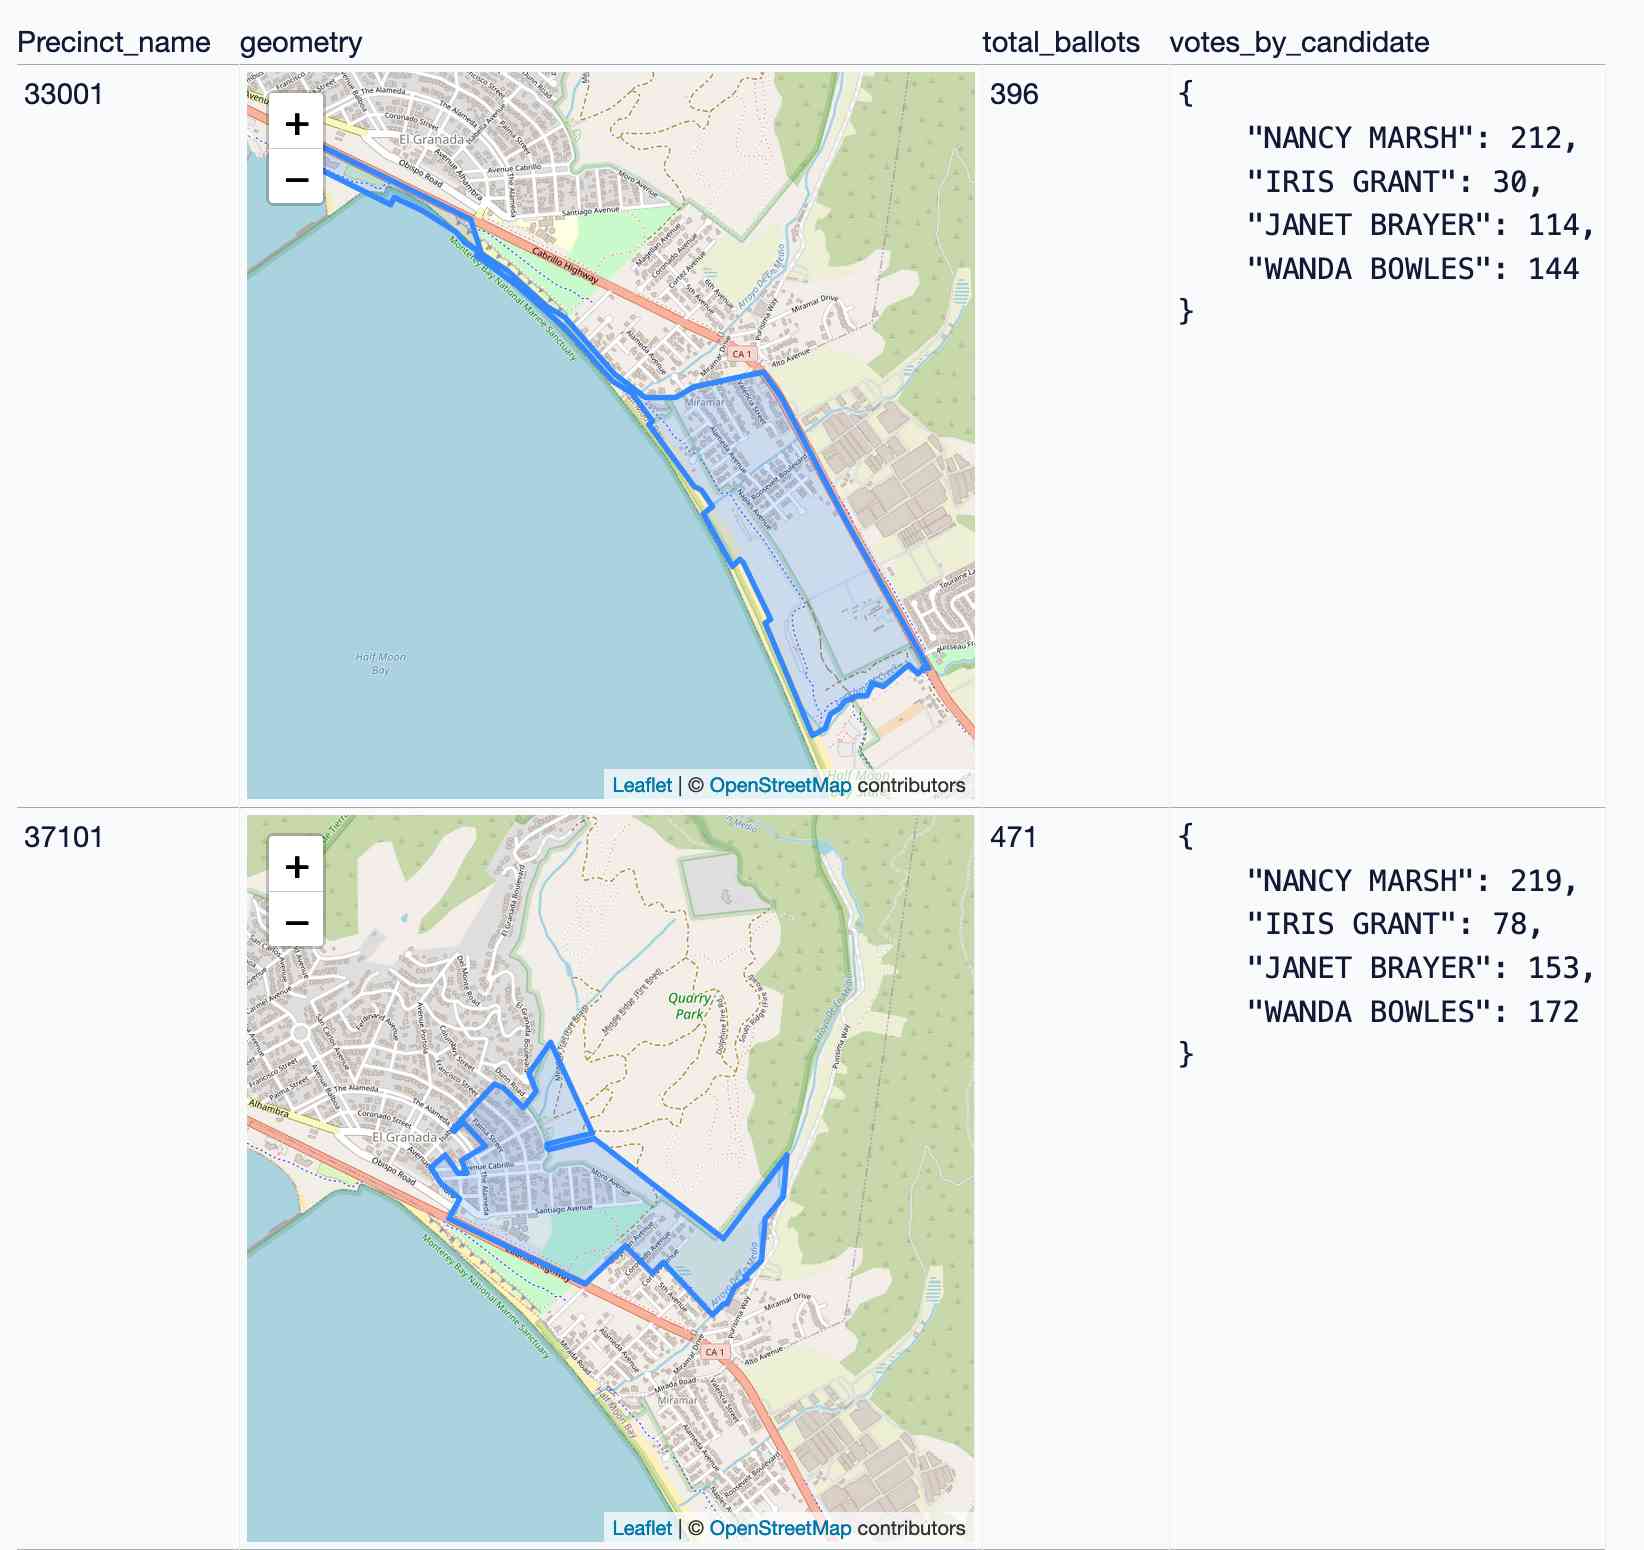
Alex Garcia and myself hosted the first Datasette Open Office Hours on Friday—a live-streamed video session where we hacked on a project together and took questions and tips from community members on Discord.
[... 3,390 words]Conflating Overture Places Using DuckDB, Ollama, Embeddings, and More.
Drew Breunig's detailed tutorial on "conflation" - combining different geospatial data sources by de-duplicating address strings such as RESTAURANT LOS ARCOS,3359 FOOTHILL BLVD,OAKLAND,94601 and LOS ARCOS TAQUERIA,3359 FOOTHILL BLVD,OAKLAND,94601.
Drew uses an entirely offline stack based around Python, DuckDB and Ollama and finds that a combination of H3 geospatial tiles and mxbai-embed-large embeddings (though other embedding models should work equally well) gets really good results.
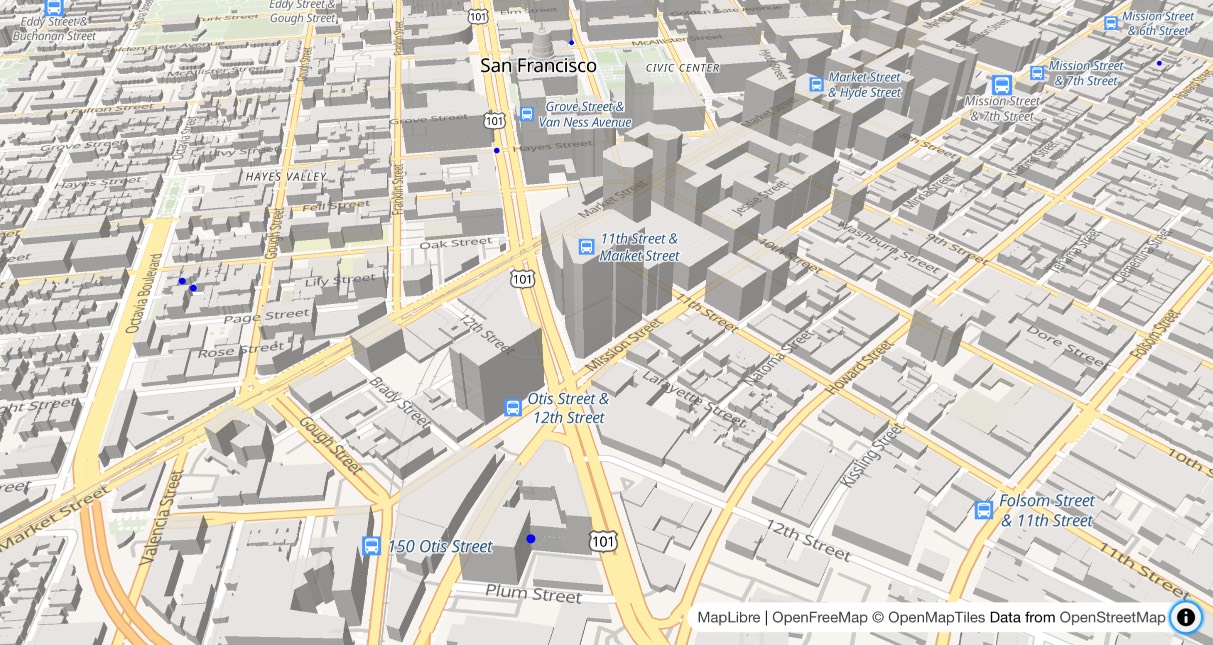
OpenFreeMap (via) New free map tile hosting service from Zsolt Ero:
OpenFreeMap lets you display custom maps on your website and apps for free. […] Using our public instance is completely free: there are no limits on the number of map views or requests. There’s no registration, no user database, no API keys, and no cookies. We aim to cover the running costs of our public instance through donations.
The site serves static vector tiles that work with MapLibre GL. It deliberately doesn’t offer any other services such as search or routing.
From the project README looks like it’s hosted on two Hetzner machines. I don’t think the public server is behind a CDN.
Part of the trick to serving the tiles efficiently is the way it takes advantage of Btrfs:
Production-quality hosting of 300 million tiny files is hard. The average file size is just 450 byte. Dozens of tile servers have been written to tackle this problem, but they all have their limitations.
The original idea of this project is to avoid using tile servers altogether. Instead, the tiles are directly served from Btrfs partition images + hard links using an optimised nginx config.
The self-hosting guide describes the scripts that are provided for downloading their pre-built tiles (needing a fresh Ubuntu server with 300GB of SSD and 4GB of RAM) or building the tiles yourself using Planetiler (needs 500GB of disk and 64GB of RAM).
Getting started is delightfully straightforward:
const map = new maplibregl.Map({
  style: 'https://tiles.openfreemap.org/styles/liberty',
  center: [13.388, 52.517],
  zoom: 9.5,
  container: 'map',
})
I got Claude to help build this demo showing a thousand random markers dotted around San Francisco. The 3D tiles even include building shapes!
Zsolt built OpenFreeMap based on his experience running MapHub over the last 9 years. Here’s a 2018 interview about that project.
It’s pretty incredible that the OpenStreetMap and open geospatial stack has evolved to the point now where it’s economically feasible for an individual to offer a service like this. I hope this turns out to be sustainable. Hetzner charge just €1 per TB for bandwidth (S3 can cost $90/TB) which should help a lot.
Towards Standardizing Place. Overture Maps announced General Availability of its global maps datasets last week, covering places, buildings, divisions, and base layers.
Drew Breunig demonstrates how this can be accessed using both the Overture Explorer tool and DuckDB, and talks about Overture's GERS IDs - reminiscent of Who's On First IDs - which provide stable IDs for all kinds of geographic places.
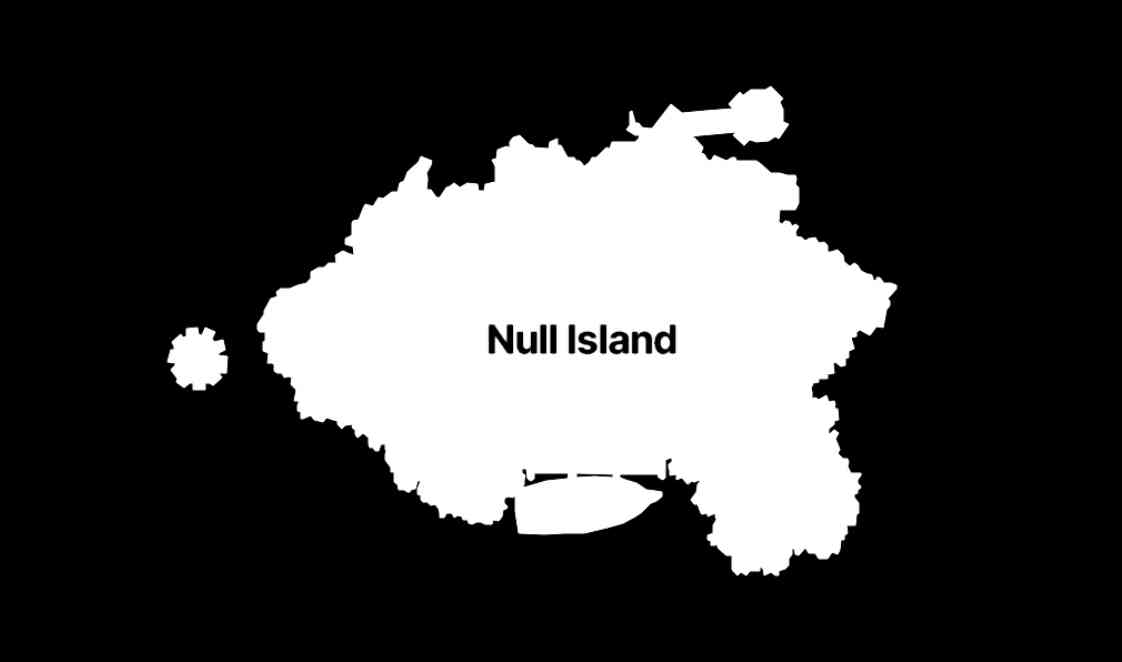
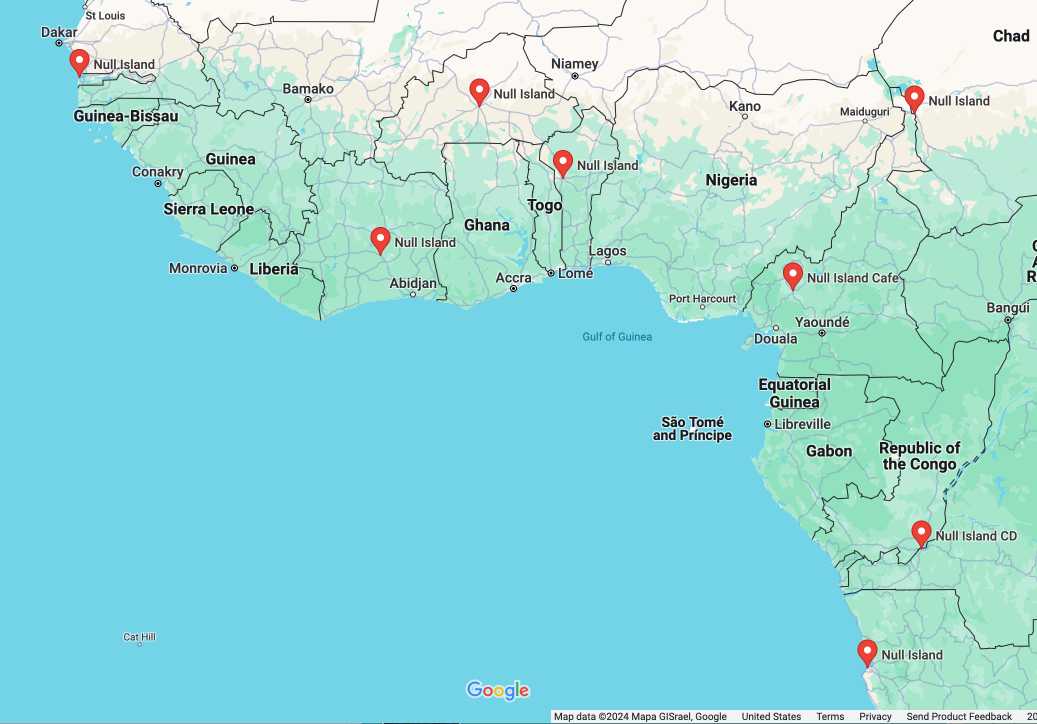
The many lives of Null Island (via) Stamen's custom basemaps have long harbored an Easter egg: zoom all the way in on 0, 0 to see the outline of the mystical "null island", the place where GIS glitches and data bugs accumulate, in the Gulf of Guinea south of Ghana.
Stamen's Alan McConchie provides a detailed history of the Easter egg - first introduced by Mike Migurski in 2010 - along with a definitive guide to the GIS jokes and traditions that surround it.
Here's Null Island on Stamen's Toner map. The shape (also available as GeoJSON) is an homage to the island from 1993's Myst, hence the outline of a large docked ship at the bottom.
Alan recently gave a talk about Stamen's updated custom maps at State of the Map US 2024 (video, slides) - their Toner and Terrain maps are now available as vector tiles served by Stadia Maps (here's the announcement), but their iconic watercolor style is yet to be updated to vectors, due to the weird array of raster tricks it used to achieve the effect.
In researching this post I searched for null island on Google Maps and was delighted to learn that a bunch of entrepreneurs in Western Africa have tapped into the meme for their own businesses:
Searching an aerial photo with text queries. Robin Wilson built a demo that lets you search a large aerial photograph of Southampton for things like "roundabout" or "tennis court". He explains how it works in detail: he used the SkyCLIP model, which is trained on "5.2 million remote sensing image-text pairs in total, covering more than 29K distinct semantic tags" to generate embeddings for 200x200 image segments (with 100px of overlap), then stored them in Pinecone.
tiny-world-map (via) I love this project. It’s a JavaScript file (694K uncompressed, 283KB compressed) which can be used with the Leaflet mapping library and provides a SVG base map of the world with country borders and labels for every world city with a population more than 48,000—10,000 cities total.
This means you can bundle an offline map of the world as part of any application that doesn’t need a higher level of detail. A lot of smaller island nations are missing entirely though, so this may not be right for every project.
It even includes a service worker to help implement offline mapping support, plus several variants of the map with less cities that are even smaller.
A POI Database in One Line (via) Overture maps offer an extraordinarily useful freely licensed databases of POI (point of interest) listings, principally derived from partners such as Facebook and including restaurants, shops, museums and other locations from all around the world.
Their new "overturemaps" Python CLI utility makes it easy to quickly pull subsets of their data... but requires you to provide a bounding box to do so.
Drew Breunig came up with this delightful recipe for fetching data using LLM and gpt-3.5-turbo to fill in those bounding boxes:
overturemaps download --bbox=$(llm 'Give me a bounding box for Alameda, California expressed as only four numbers delineated by commas, with no spaces, longitude preceding latitude.') -f geojsonseq --type=place | geojson-to-sqlite alameda.db places - --nl --pk=id
mapshaper.org (via) It turns out the mapshaper CLI tool for manipulating geospatial data—including converting shapefiles to GeoJSON and back again—also has a web UI that runs the conversions entirely in your browser. If you need to convert between those (and other) formats it’s hard to imagine a more convenient option.
Claude and ChatGPT for ad-hoc sidequests
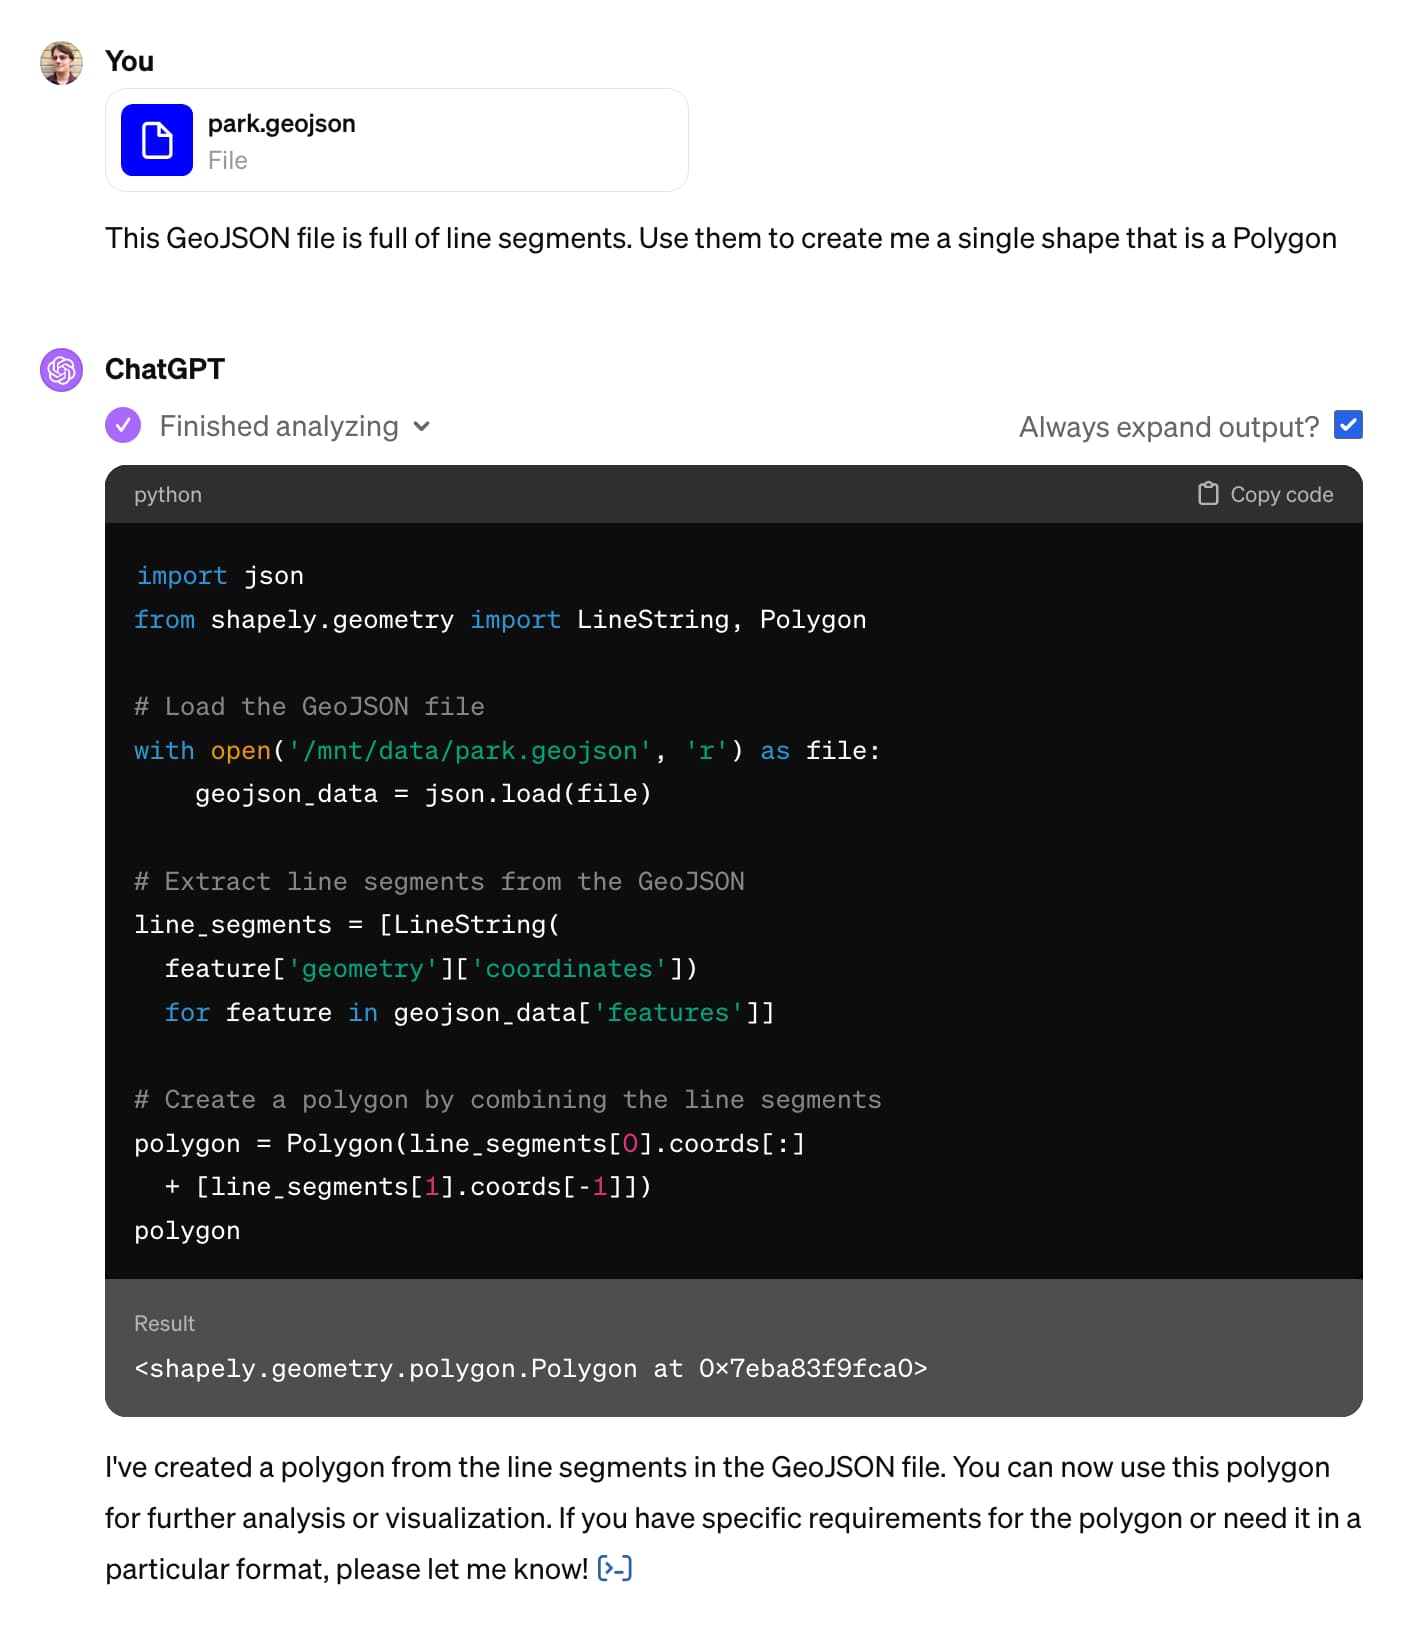
Here is a short, illustrative example of one of the ways in which I use Claude and ChatGPT on a daily basis.
[... 1,754 words]How to make self-hosted maps that work everywhere and cost next to nothing. Chris Amico provides a detailed roundup of the state of web mapping in 2024. It’s never been easier to entirely host your own mapping infrastructure, thanks to OpenStreetMap, Overture, MBTiles, PMTiles, Maplibre and a whole ecosystem of other fine open source projects.
I like Protomaps creator Brandon Liu’s description of this: “post-scarcity web mapping”.
2023
Database generated columns: GeoDjango & PostGIS. Paolo Melchiorre advocated for the inclusion of generated columns, one of the biggest features in Django 5.0. Here he provides a detailed tutorial showing how they can be used with PostGIS to create database tables that offer columns such as geohash that are automatically calculated from other columns in the table.
Geospatial SQL queries in SQLite using TG, sqlite-tg and datasette-sqlite-tg. Alex Garcia built sqlite-tg—a SQLite extension that uses the brand new TG geospatial library to provide a whole suite of custom SQL functions for working with geospatial data.
Here are my notes on trying out his initial alpha releases. The extension already provides tools for converting between GeoJSON, WKT and WKB, plus the all important tg_intersects() function for testing if a polygon or point overlap each other.
It’s pretty useful already. Without any geospatial indexing at all I was still able to get 700ms replies to a brute-force point-in-polygon query against 150MB of GeoJSON timezone boundaries stored as JSON text in a table.
TG: Polygon indexing (via) TG is a brand new geospatial library by Josh Baker, author of the Tile38 in-memory spatial server (kind of a geospatial Redis). TG is written in pure C and delivered as a single C file, reminiscent of the SQLite amalgamation.
TG looks really interesting. It implements almost the exact subset of geospatial functionality that I find most useful: point-in-polygon, intersect, WKT, WKB, and GeoJSON—all with no additional dependencies.
The most interesting thing about it is the way it handles indexing. In this documentation Josh describes two approaches he uses to speeding up point-in-polygon and intersection using a novel approach that goes beyond the usual RTree implementation.
I think this could make the basis of a really useful SQLite extension—a lighter-weight alternative to SpatiaLite.
Overture Maps Foundation Releases Its First World-Wide Open Map Dataset. The Overture Maps Foundation is a collaboration lead by Amazon, Meta, Microsoft and TomTom dedicated to producing “reliable, easy-to-use, and interoperable open map data”.
Yesterday they put out their first release and it’s pretty astonishing: four different layers of geodata, covering Places of Interest (shops, restaurants, attractions etc), administrative boundaries, building outlines and transportation networks.
The data is available as Parquet. I just downloaded the 8GB places dataset and can confirm that it contains 59 million listings from around the world—I filtered to just places in my local town and a spot check showed that recently opened businesses (last 12 months) were present and the details all looked accurate.
The places data is licensed under “Community Data License Agreement – Permissive” which looks like the only restriction is that you have to include that license when you further share the data.
2022
GPSJam (via) John Wiseman’s “Daily maps of GPS interference” —a beautiful interactive globe (powered by Mapbox GL) which you can use to see points of heaviest GPS interference over a 24 hour period, using data collected from commercial airline radios by ADS-B Exchange. “From what I can tell the most common reason for aircraft GPS systems to have degraded accuracy is jamming by military systems. At least, the vast majority of aircraft that I see with bad GPS accuracy are flying near conflict zones where GPS jamming is known to occur.”
A tiny web app to create images from OpenStreetMap maps
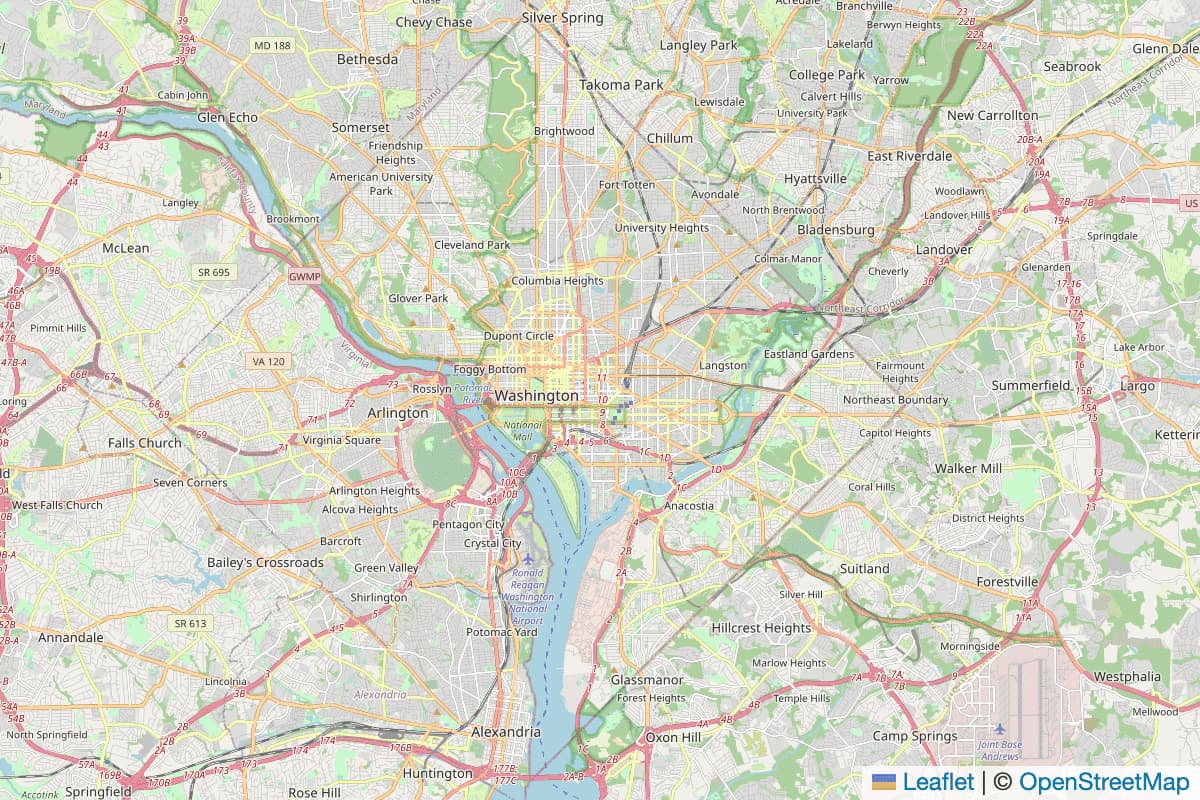
Earlier today I found myself wanting to programmatically generate some images of maps.
[... 1,388 words]Datasette for geospatial analysis (via) I added a new page to the Datasette website describing how Datasette can be used for geospatial analysis, pulling together several of the relevant plugins and tools from the Datasette ecosystem.