6 posts tagged “spreadsheets”
2025
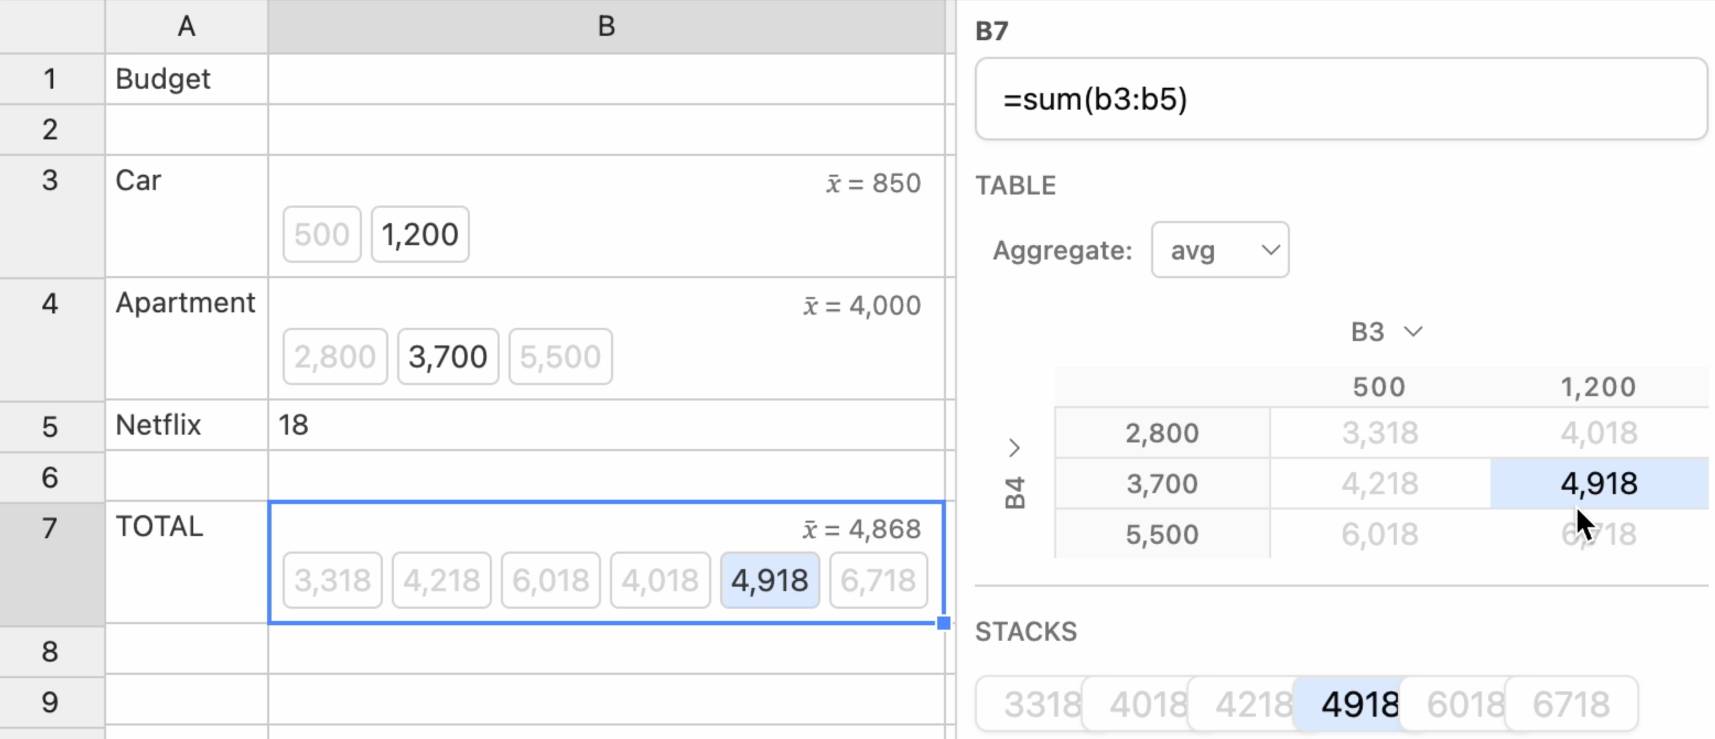
Ambsheets: Spreadsheets for exploring scenarios (via) Delightful UI experiment by Alex Warth and Geoffrey Litt at Ink & Switch, exploring the idea of a spreadsheet with cells that can handle multiple values at once, which they call "amb" (for "ambiguous") values. A single sheet can then be used to model multiple scenarios.
Here the cell for "Car" contains {500, 1200} and the cell for "Apartment" contains {2800, 3700, 5500}, resulting in a "Total" cell with six different values. Hovering over a calculated highlights its source values and a side panel shows a table of calculated results against those different combinations.
Always interesting to see neat ideas like this presented on top of UIs that haven't had a significant upgrade in a very long time.
2024
So VisiCalc came and went, but the software genre it pioneered – the spreadsheet – endured to become arguably the most influential type of code ever written, at least in the sense of touching the lives of millions of office workers. I’ve never worked in an organisation in which spreadsheet software was not at the heart of most accounting, budgeting and planning activities. I’ve even known professionals for whom it’s the only piece of PC software they’ve ever used: one elderly accountant of my acquaintance, for example, used Excel even for his correspondence; he simply widened column A to 80 characters, typed his text in descending cells and hit the “print” key.
Spreadsheets are not just tools for doing "what-if" analysis. They provide a specific data structure: a table. Most Excel users never enter a formula. They use Excel when they need a table. The gridlines are the most important feature of Excel, not recalc.
2021
The Tyranny of Spreadsheets (via) In discussing the notorious Excel incident last year when the UK lost track of 16,000 Covid cases due to a .xls row limit, Tim Harford presents a history of the spreadsheet, dating all the way back to Francesco di Marco Datini and double-entry bookkeeping in 1396. A delightful piece of writing.
2020
Wildcard: Spreadsheet-Driven Customization of Web Applications (via) What a fascinating collection of ideas. Wildcard is a browser extension (currently using Tampermonkey and sadly not yet available to try out) which lets you add “spreadsheet-driven customization” to any web application. Watching the animated screenshots in the videos helps explain what this mean—essentially it’s a two-way scraping trick, where content on the page (e.g. Airbnb listings) are extracted into a spreadsheet-like table interface using JavaScript—but then interactions you make in that spreadsheet like filtering and sorting are reflected back on the original page. It even has the ability to serve editable cells by mapping them to form inputs on the page. Lots to think about here.
2009
US economic data spreadsheets from the Guardian. At the Guardian we’ve just released a bunch of economic data about the US painstakingly collected by Simon Rogers, our top data journalist, as Google Docs spreadsheets. Get your data here.