11 posts tagged “observability”
2026
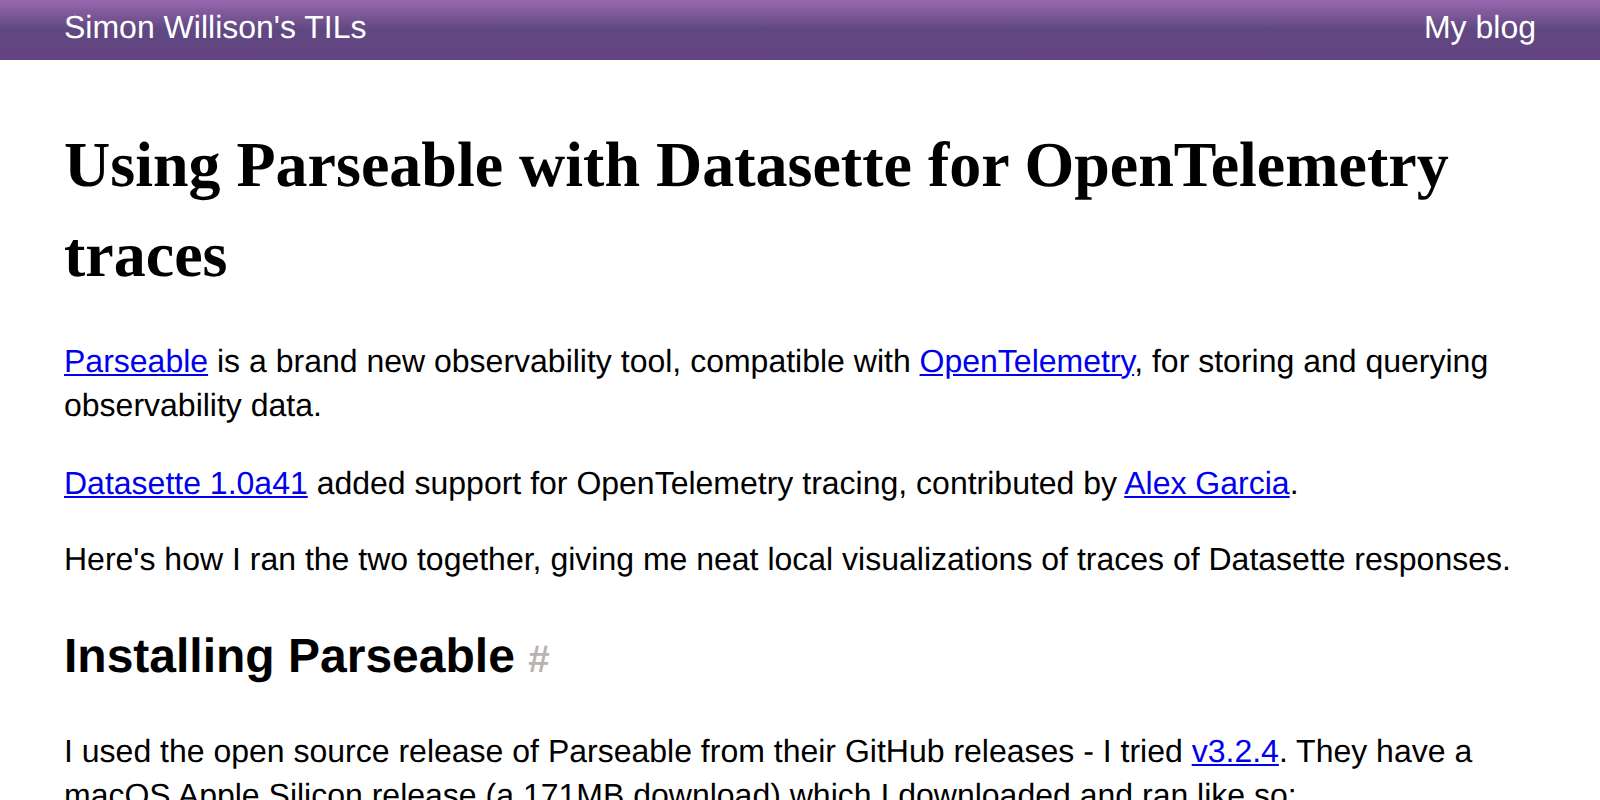
I saw Parseable in a Show HN today - it's a new observability platform with both an open source (AGPL) Rust implementation (a single ~180MB binary), an "Enterprise" version with extra features and a cloud hosted option.
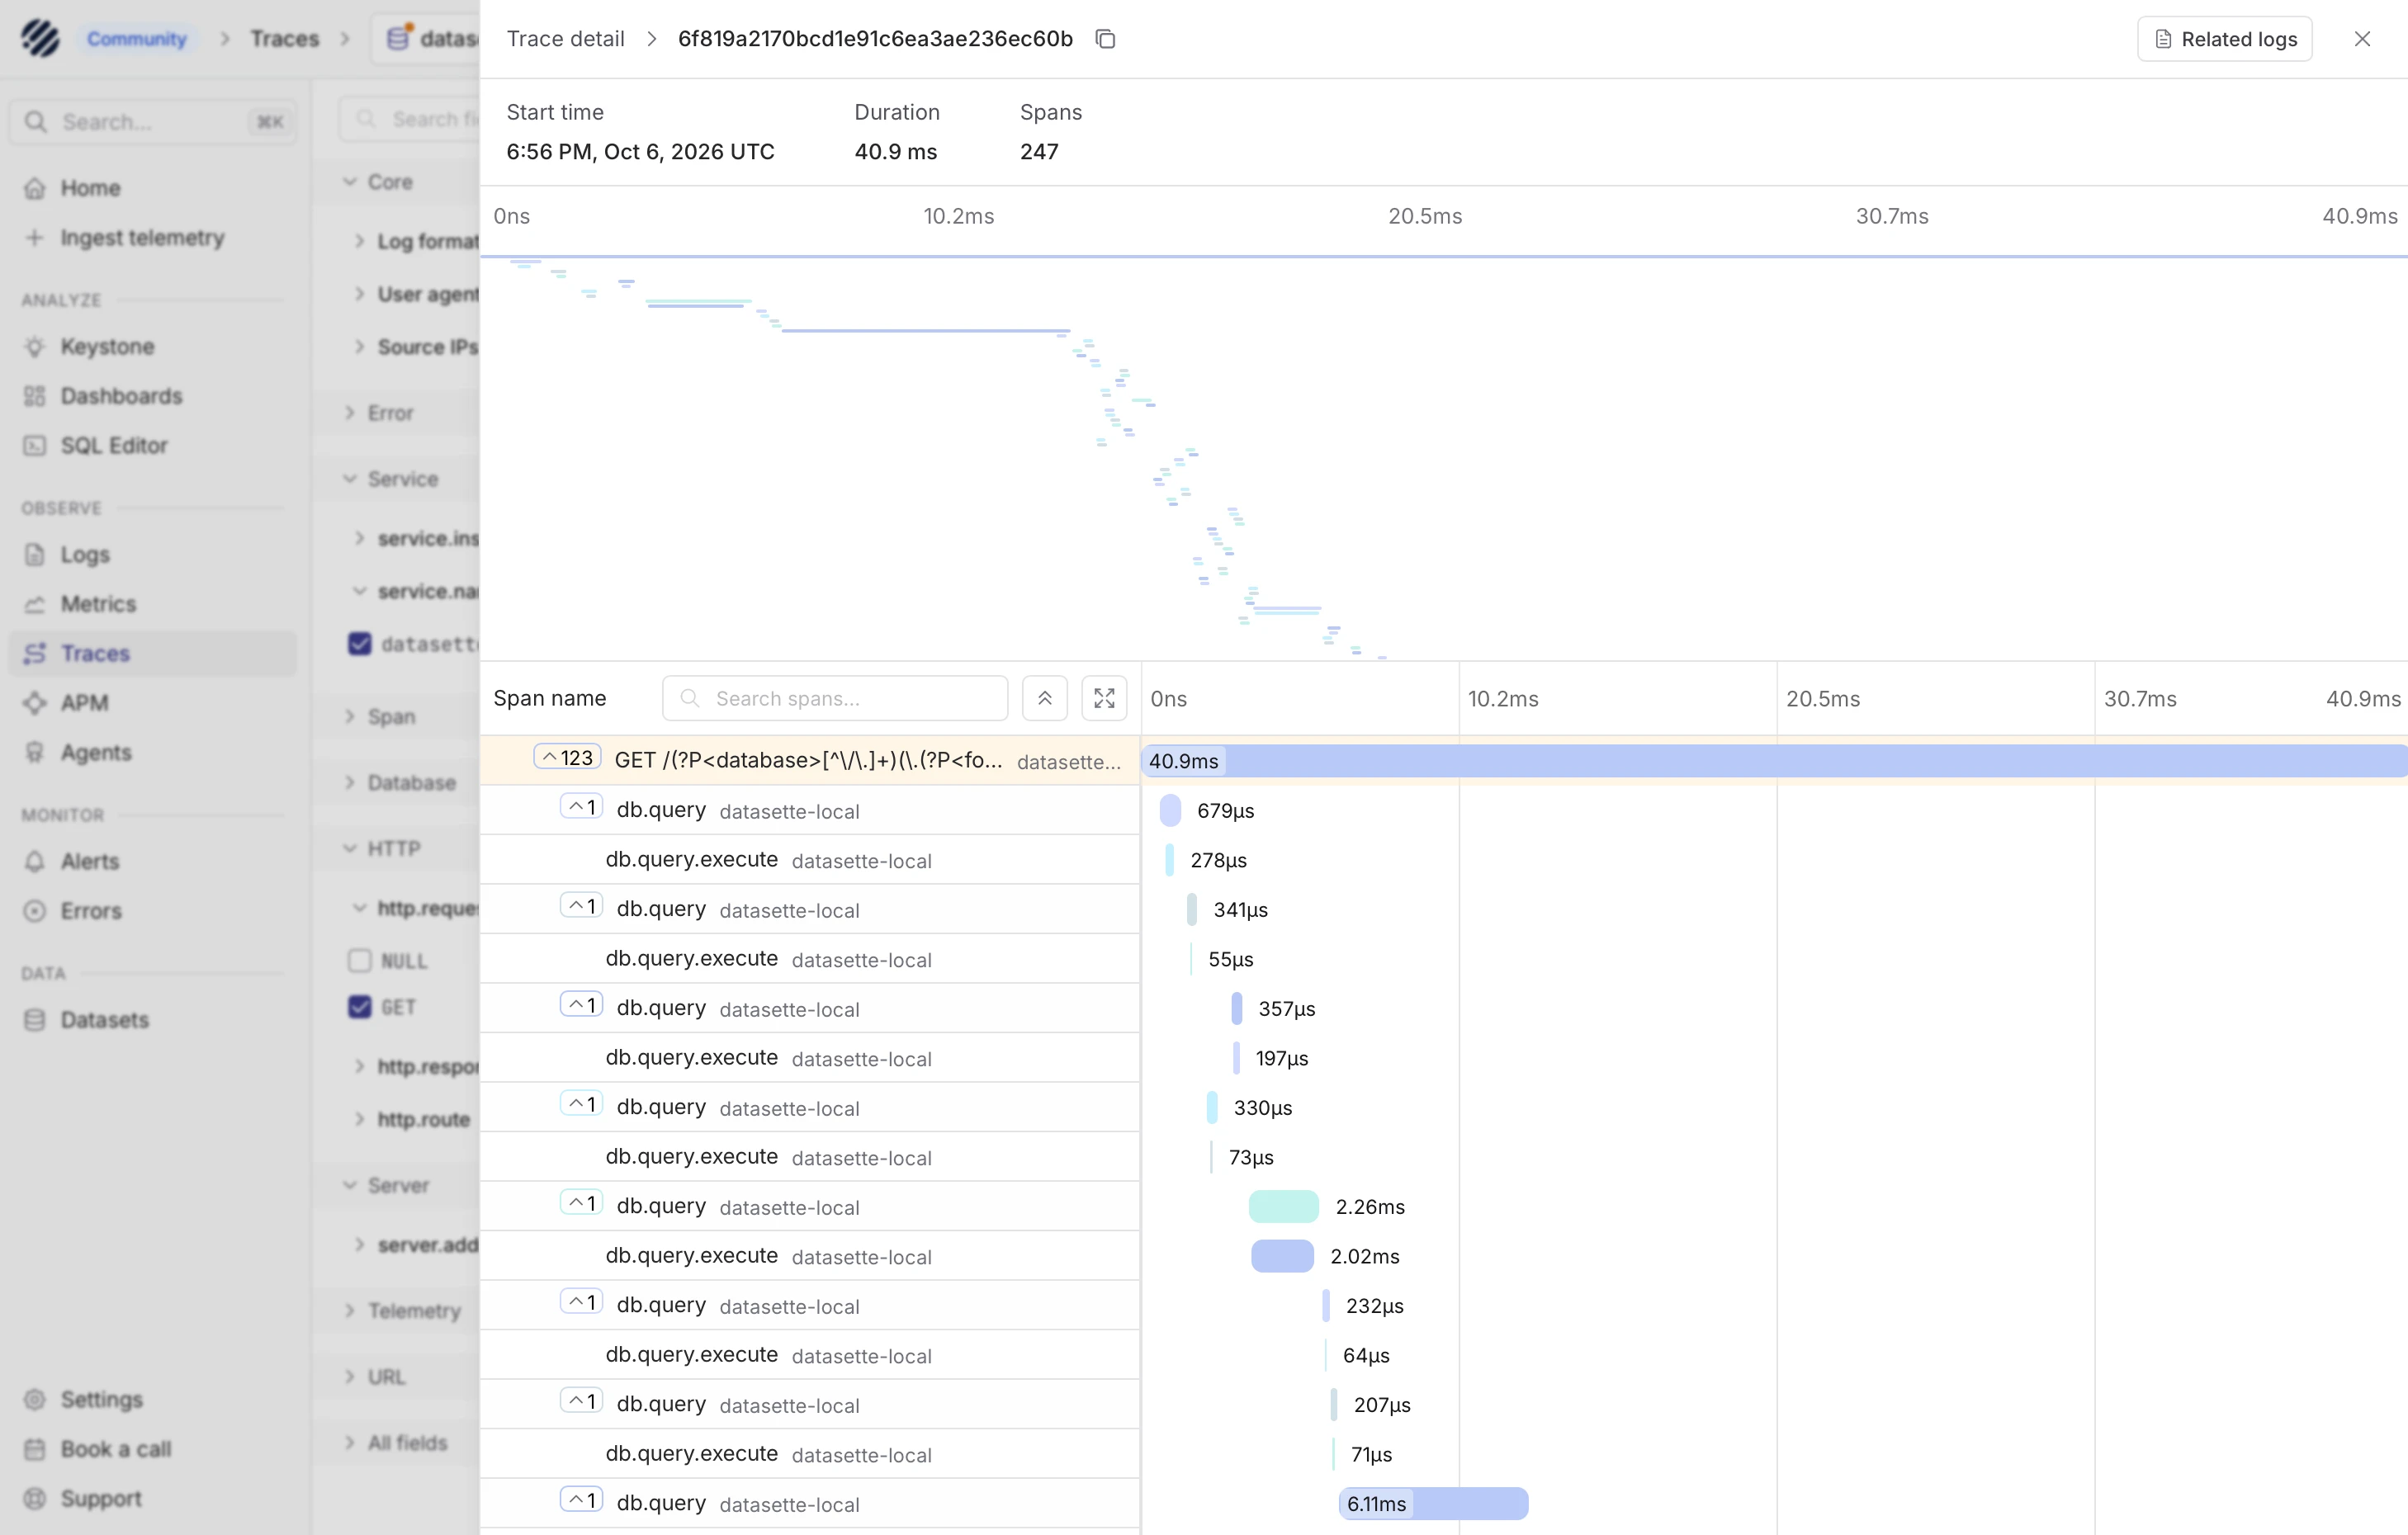
Since Datasette 1.0a41 added OpenTelemetry support (thanks, Alex Garcia), I decided to fire up Codex and have it figure out how to run Parseable and feed it traces from Datasette.
Here's my (human-written) TIL showing the patterns that worked, and here's a screenshot of a Datasette trace displayed within the Parseable localhost web application:
Graham Dumpleton's new monkey patching package wrapture is shaping up to be an indispensable tool for Python developers. I'm not sure why I've seen so little buzz about it!
Graham has been posting new tutorials for it almost daily since the initial release on August 31st. Here's everything he's published so far:
- Introducing wrapture - a new monkey patching library that serves both testing and observability (think New Relic style tracing) at the same time.
- Unit testing with wrapture - how to use it for the same kinds of thing as
unittest.mock. - Recording calls with wrapture - recording method calls as timelines and processing and displaying them as trees.
- Phased behaviour in wrapture - arranging patched methods to change behavior across multiple calls.
- Beyond callables in wrapture - monkey patching attributes, dictionaries, generators.
- Live tracing with wrapture - tracing a live application to see exactly how it works.
- Zero-code tracing with wrapture - configuring tracing in a separate TOML file without modifying Python code at all.
- Tracing Flask with wrapture - using the separate wrapture-instrumenation package to instrument a Flask application. That package also provides instrumentation for
aiohttp.client,aiohttp.web,django,fastapi,flask,grpc,http.client,httpx,jinja2,requests,sqlalchemy,sqlite3,starlette,urllib.request,urllib3,uvicorn,werkzeug.serving,wsgiref.simple_server,xmlrpc.client,xmlrpc.server. - Finding slow code with wrapture - wrapture's tools for recording timing information, both individually and aggregated across multiple calls.
- OpenTelemetry export in wrapture - exporting traces to OpenTelemetry.
Graham also has a set of interactive workshops for wrapture, implemented as JupyterLab notebooks.
Wrapture is still alpha software but it's already very usable - especially given you can configure and try it out with a TOML file without modifying any Python code at all.
This feels like one of those Swiss Army Knife packages that, once mastered, will provide value against all sorts of problems for years to come.
Introducing wrapture. New from Graham Dumpleton (of wrapt, mod_wsgi, and New Relic's Python agent fame), who describes Wrapture as taking the monkeypatching ideas from wrapt and extending them to apply to testing and tracing at the same time.
Wrapture (full documentation here) makes it easy to wrap any function or method such that all access can be traced, or can be overridden to return a different value.
It acts as both an alternative to unittest.mock and a way to implement tracing against an existing project:
Attaching observation to code you do not control, recording what flows through it, and doing so without disturbing the program being watched, is a problem I have never really stopped thinking about.
Wrapture includes OpenTelemetry support and even has an entirely configuration-based mechanism for adding tracing to an existing Python project, which looks like this:
capture = "summary"

[[observe]]
target = "domain:Calculator"
name = ["outer", "inner"]

[[sink]]
type = "jsonlines"
path = "trace.jsonl"
This is still a very young project - just a few weeks old - but it's off to a very promising start.
Interestingly, this is also Graham's first attempt at large entirely agent-driven project:
Every line of code and documentation in wrapture was written by an AI assistant working under my direction. I want to be upfront about that, and equally upfront about what it was not. This was not vibe coding, where a one-shot prompt produces a pile of generated code and the person driving hopes for the best because they lack the knowledge to judge what came back. Vibe coding has earned its bad reputation. I engineered wrapture carefully from the start. I have spent a long time in this particular corner of Python and knew exactly what the result needed to be, and the AI was the means of producing it rather than the source of the design.
In a follow-up post, Unit testing with wrapture, Graham shows the testing patterns supported by the new library:
def test_stub_with_wrapture():
    with wrapture.binding(
        Gateway, "charge"
    ).on_call.returns({
        "id": "stub", "amount": 0}
    ):
        assert OrderService().place(
            500
        )["id"] == "stub"
And this neat example of a test that calls and then modifies the return value from the original method:
def test_pinned_result_with_wrapture():
    charge = wrapture.binding(
        Gateway, "charge"
    )
    charge.on_call.transforms_result(
        lambda r: {**r, "id": "ch_TEST"}
    )
    with charge:
        assert OrderService().place(
           500
        ) == {
            "id": "ch_TEST", "amount": 500
        }
(In both of these examples the OrderService().place(...) method calls Gateway().charge(...).)
2024
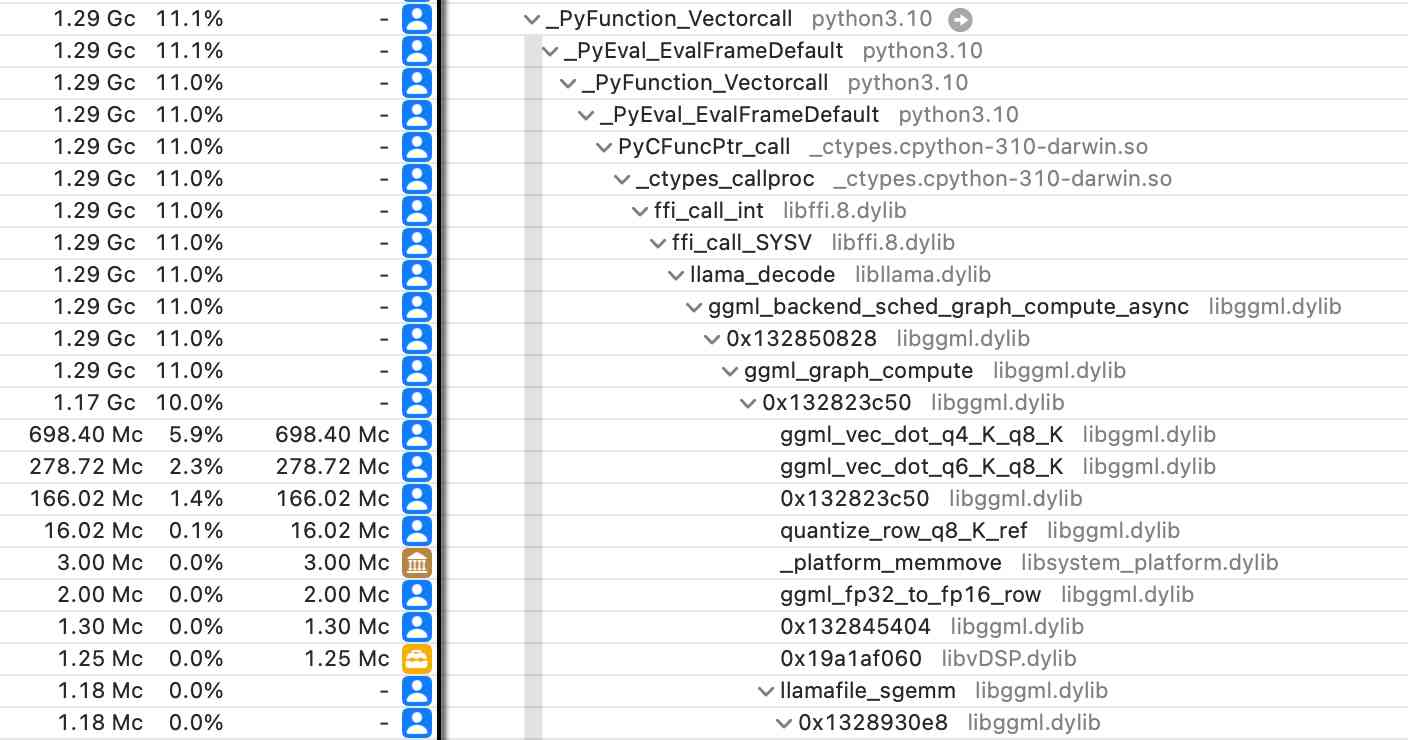
Did you know about Instruments? (via) Thorsten Ball shows how the macOS Instruments app (installed as part of Xcode) can be used to run a CPU profiler against any application - not just code written in Swift/Objective C.
I tried this against a Python process running LLM executing a Llama 3.1 prompt with my new llm-gguf plugin and captured this:
All you need is Wide Events, not “Metrics, Logs and Traces” (via) I’ve heard great things about Meta’s internal observability platform Scuba, here’s an explanation from ex-Meta engineer Ivan Burmistrov describing the value it provides and comparing it to the widely used OpenTelemetry stack.
2022
Roblox Return to Service 10/28-10/31 2021 (via) A particularly good example of a public postmortem on an outage. Roblox was down for 72 hours last year, as a result of an extremely complex set of circumstances which took a lot of effort to uncover. It’s interesting to think through what kind of monitoring you would need to have in place to help identify the root cause of this kind of issue.
2021
When I was a performance consultant I'd show up to random companies who wanted me to fix their computer performance issues. If they trusted me with a login to their production servers, I could help them a lot quicker. To get that trust I knew which tools looked but didn't touch: Which were observability tools and which were experimental tools. "I'll start with observability tools only" is something I'd say at the start of every engagement.
2020
Instead of seeing instrumentation as a last-ditch effort of strings and metrics, we must think about propagating the full context of a request and emitting it at regular pulses. No pull request should ever be accepted unless the engineer can answer the question, “How will I know if this breaks?”
2019
Logs vs. metrics: a false dichotomy (via) Nick Stenning discusses the differences between logs and metrics: most notably that metrics can be derived from logs but logs cannot be reconstituted starting with time-series metrics.
Targeted diagnostic logging in production (via) Will Sargent defines diagnostic logging as “debug logging statements with an audience”, and proposes controlling this style if logging via a feature flat system to allow detailed logging to be turned on in production against a selected subset if users in order to help debug difficult problems. Lots of great background material in the topic of observability here too.
Metrics are lossily compressed logs. Traces are logs with parent child relationships between entries. The only reason we have three terms is because getting value from them has required different compromises to make them cost effective.