95 posts tagged “performance”
2026
Shopify/liquid: Performance: 53% faster parse+render, 61% fewer allocations (via) PR from Shopify CEO Tobias Lütke against Liquid, Shopify's open source Ruby template engine that was somewhat inspired by Django when Tobi first created it back in 2005.
Tobi found dozens of new performance micro-optimizations using a variant of autoresearch, Andrej Karpathy's new system for having a coding agent run hundreds of semi-autonomous experiments to find new effective techniques for training nanochat.
Tobi's implementation started two days ago with this autoresearch.md prompt file and an autoresearch.sh script for the agent to run to execute the test suite and report on benchmark scores.
The PR now lists 93 commits from around 120 automated experiments. The PR description lists what worked in detail - some examples:
- Replaced StringScanner tokenizer with
String#byteindex. Single-bytebyteindexsearching is ~40% faster than regex-basedskip_until. This alone reduced parse time by ~12%.- Pure-byte
parse_tag_token. Eliminated the costlyStringScanner#string=reset that was called for every{% %}token (878 times). Manual byte scanning for tag name + markup extraction is faster than resetting and re-scanning via StringScanner. [...]- Cached small integer
to_s. Pre-computed frozen strings for 0-999 avoid 267Integer#to_sallocations per render.
This all added up to a 53% improvement on benchmarks - truly impressive for a codebase that's been tweaked by hundreds of contributors over 20 years.
I think this illustrates a number of interesting ideas:
- Having a robust test suite - in this case 974 unit tests - is a massive unlock for working with coding agents. This kind of research effort would not be possible without first having a tried and tested suite of tests.
- The autoresearch pattern - where an agent brainstorms a multitude of potential improvements and then experiments with them one at a time - is really effective.
- If you provide an agent with a benchmarking script "make it faster" becomes an actionable goal.
- CEOs can code again! Tobi has always been more hands-on than most, but this is a much more significant contribution than anyone would expect from the leader of a company with 7,500+ employees. I've seen this pattern play out a lot over the past few months: coding agents make it feasible for people in high-interruption roles to productively work with code again.
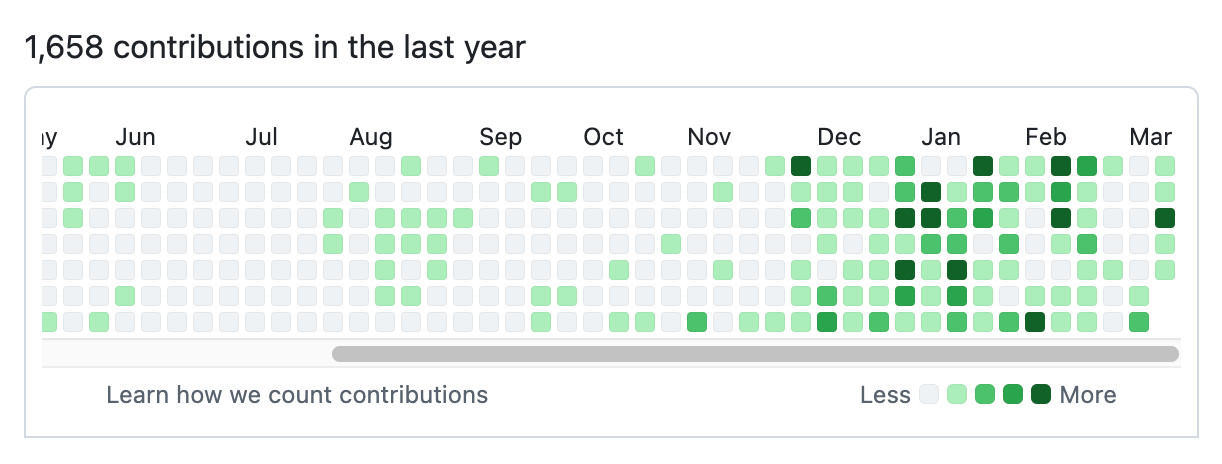
Here's Tobi's GitHub contribution graph for the past year, showing a significant uptick following that November 2025 inflection point when coding agents got really good.
He used Pi as the coding agent and released a new pi-autoresearch plugin in collaboration with David Cortés, which maintains state in an autoresearch.jsonl file like this one.
2025
How uv got so fast.
Andrew Nesbitt provides an insightful teardown of why uv is so much faster than pip. It's not nearly as simple as just "they rewrote it in Rust" - uv gets to skip a huge amount of Python packaging history (which pip needs to implement for backwards compatibility) and benefits enormously from work over recent years that makes it possible to resolve dependencies across most packages without having to execute the code in setup.py using a Python interpreter.
Two notes that caught my eye that I hadn't understood before:
HTTP range requests for metadata. Wheel files are zip archives, and zip archives put their file listing at the end. uv tries PEP 658 metadata first, falls back to HTTP range requests for the zip central directory, then full wheel download, then building from source. Each step is slower and riskier. The design makes the fast path cover 99% of cases. None of this requires Rust.
[...]
Compact version representation. uv packs versions into u64 integers where possible, making comparison and hashing fast. Over 90% of versions fit in one u64. This is micro-optimization that compounds across millions of comparisons.
I wanted to learn more about these tricks, so I fired up an asynchronous research task and told it to checkout the astral-sh/uv repo, find the Rust code for both of those features and try porting it to Python to help me understand how it works.
Here's the report that it wrote for me, the prompts I used and the Claude Code transcript.
You can try the script it wrote for extracting metadata from a wheel using HTTP range requests like this:
uv run --with httpx https://raw.githubusercontent.com/simonw/research/refs/heads/main/http-range-wheel-metadata/wheel_metadata.py https://files.pythonhosted.org/packages/8b/04/ef95b67e1ff59c080b2effd1a9a96984d6953f667c91dfe9d77c838fc956/playwright-1.57.0-py3-none-macosx_11_0_arm64.whl -v
The Playwright wheel there is ~40MB. Adding -v at the end causes the script to spit out verbose details of how it fetched the data - which looks like this.
Key extract from that output:
[1] HEAD request to get file size...
    File size: 40,775,575 bytes
[2] Fetching last 16,384 bytes (EOCD + central directory)...
    Received 16,384 bytes
[3] Parsed EOCD:
    Central directory offset: 40,731,572
    Central directory size: 43,981
    Total entries: 453
[4] Fetching complete central directory...
    ...
[6] Found METADATA: playwright-1.57.0.dist-info/METADATA
    Offset: 40,706,744
    Compressed size: 1,286
    Compression method: 8
[7] Fetching METADATA content (2,376 bytes)...
[8] Decompressed METADATA: 3,453 bytes

Total bytes fetched: 18,760 / 40,775,575 (100.0% savings)
The section of the report on compact version representation is interesting too. Here's how it illustrates sorting version numbers correctly based on their custom u64 representation:
Sorted order (by integer comparison of packed u64):
  1.0.0a1 (repr=0x0001000000200001)
  1.0.0b1 (repr=0x0001000000300001)
  1.0.0rc1 (repr=0x0001000000400001)
  1.0.0 (repr=0x0001000000500000)
  1.0.0.post1 (repr=0x0001000000700001)
  1.0.1 (repr=0x0001000100500000)
  2.0.0.dev1 (repr=0x0002000000100001)
  2.0.0 (repr=0x0002000000500000)
Python 3.14 Is Here. How Fast Is It?
(via)
Miguel Grinberg uses some basic benchmarks (like fib(40)) to test the new Python 3.14 on Linux and macOS and finds some substantial speedups over Python 3.13 - around 27% faster.
The optional JIT didn't make a meaningful difference to his benchmarks. On a threaded benchmark he got 3.09x speedup with 4 threads using the free threading build - for Python 3.13 the free threading build only provided a 2.2x improvement.
Postgres LISTEN/NOTIFY does not scale (via) I think this headline is justified. Recall.ai, a provider of meeting transcription bots, noticed that their PostgreSQL instance was being bogged down by heavy concurrent writes.
After some spelunking they found this comment in the PostgreSQL source explaining that transactions with a pending notification take out a global lock against the entire PostgreSQL instance (represented by database 0) to ensure "that queue entries appear in commit order".
Moving away from LISTEN/NOTIFY to trigger actions on changes to rows gave them a significant performance boost under high write loads.
Serving 200 million requests per day with a cgi-bin (via) Jake Gold tests how well 90s-era CGI works today, using a Go + SQLite CGI program running on a 16-thread AMD 3700X.
Using CGI on modest hardware, it’s possible to serve 2400+ requests per second or 200M+ requests per day.
I got my start in web development with CGI back in the late 1990s - I was a huge fan of NewsPro, which was effectively a weblog system before anyone knew what a weblog was.
CGI works by starting, executing and terminating a process for every incoming request. The nascent web community quickly learned that this was a bad idea, and invented technologies like PHP and FastCGI to help avoid that extra overhead and keep code resident in-memory instead.
This lesson ended up baked into my brain, and I spent the next twenty years convinced that you should never execute a full process as part of serving a web page.
Of course, computers in those two decades got a lot faster. I finally overcame that twenty-year core belief in 2020, when I built datasette-ripgrep, a Datasette plugin that shells out to the lightning fast ripgrep CLI tool (written in Rust) to execute searches. It worked great!
As was pointed out on Hacker News, part of CGI's problem back then was that we were writing web scripts in languages like Perl, Python and Java which had not been designed for lightning fast startup speeds. Using Go and Rust today helps make CGI-style requests a whole lot more effective.
Jake notes that CGI-style request handling is actually a great way to take advantage of multiple CPU cores:
These days, we have servers with 384 CPU threads. Even a small VM can have 16 CPUs. The CPUs and memory are much faster as well.
Most importantly, CGI programs, because they run as separate processes, are excellent at taking advantage of many CPUs!
Maybe we should start coding web applications like it's 1998, albeit with Go and Rust!
To clarify, I don't think most people should do this. I just think it's interesting that it's not as bad an idea as it was ~25 years ago.
python-importtime-graph.
I was exploring why a Python tool was taking over a second to start running and I learned about the python -X importtime feature, documented here. Adding that option causes Python to spit out a text tree showing the time spent importing every module.
I tried that like this:
python -X importtime -m llm plugins
That's for LLM running 41 different plugins. Here's the full output from that command, which starts like this:
import time: self [us] | cumulative | imported package
import time:        77 |         77 |   _io
import time:        19 |         19 |   marshal
import time:       131 |        131 |   posix
import time:       363 |        590 | _frozen_importlib_external
import time:       450 |        450 |   time
import time:       110 |        559 | zipimport
import time:        64 |         64 |     _codecs
import time:       252 |        315 |   codecs
import time:       277 |        277 |   encodings.aliases
Kevin Michel built this excellent tool for visualizing these traces as a treemap. It runs in a browser - visit kmichel.github.io/python-importtime-graph/ and paste in the trace to get the visualization.
Here's what I got for that LLM example trace:

As you can see, it's pretty dense! Here's the SVG version which is a lot more readable, since you can zoom in to individual sections.
Zooming in it looks like this:
Making PyPI’s test suite 81% faster (via) Fantastic collection of tips from Alexis Challande on speeding up a Python CI workflow.
I've used pytest-xdist to run tests in parallel (across multiple cores) before, but the following tips were new to me:
COVERAGE_CORE=sysmon pytest --cov=myprojecttells coverage.py on Python 3.12 and higher to use the new sys.monitoring mechanism, which knocked their test execution time down from 58s to 27s.- Setting
testpaths = ["tests/"]inpytest.iniletspytestskip scanning other folders when trying to find tests. python -X importtime ...shows a trace of exactly how long every package took to import. I could have done with this last week when I was trying to debug slow LLM startup time which turned out to be caused be heavy imports.
Double-keyed Caching: How Browser Cache Partitioning Changed the Web (via) Addy Osmani provides a clear explanation of how browser cache partitioning has changed the landscape of web optimization tricks.
Prior to 2020, linking to resources on a shared CDN could provide a performance boost as the user's browser might have already cached that asset from visiting a previous site.
This opened up privacy attacks, where a malicious site could use the presence of cached assets (based on how long they take to load) to reveal details of sites the user had previously visited.
Browsers now maintain a separate cache-per-origin. This has had less of an impact than I expected: Chrome's numbers show just a 3.6% increase in overall cache miss rate and 4% increase in bytes loaded from the network.
The most interesting implication here relates to domain strategy: hosting different aspects of a service on different subdomains now incurs additional cache-related performance costs compared to keeping everything under the same domain.
2024
How we think about Threads’ iOS performance (via) This article by Dave LaMacchia and Jason Patterson provides an incredibly deep insight into what effective performance engineering looks like for an app with 100s of millions of users.
I always like hearing about custom performance metrics with their own acronyms. Here we are introduced to %FIRE - the portion of people who experience a frustrating image-render experience (based on how long an image takes to load after the user scrolls it into the viewport), TTNC (time-to-network content) measuring time from app launch to fresh content visible in the feed and cPSR (creation-publish success rate) for how often a user manages to post content that they started to create.
This article introduced me to the concept of a boundary test, described like this:
A boundary test is one where we measure extreme ends of a boundary to learn what the effect is. In our case, we introduced a slight bit of latency when a small percentage of our users would navigate to a user profile, to the conversion view for a post, or to their activity feed.
This latency would allow us to extrapolate what the effect would be if we similarly improved how we delivered content to those views.
[...]
We learned that iOS users don’t tolerate a lot of latency. The more we added, the less often they would launch the app and the less time they would stay in it. With the smallest latency injection, the impact was small or negligible for some views, but the largest injections had negative effects across the board. People would read fewer posts, post less often themselves, and in general interact less with the app. Remember, we weren’t injecting latency into the core feed, either; just into the profile, permalink, and activity.
There's a whole lot more in there, including details of their custom internal performance logger (SLATE, the “Systemic LATEncy” logger) and several case studies of surprising performance improvements made with the assistance of their metrics and tools, plus some closing notes on how Swift concurrency is being adopted throughout Meta.
Using Rust in non-Rust servers to improve performance (via) Deep dive into different strategies for optimizing part of a web server application - in this case written in Node.js, but the same strategies should work for Python as well - by integrating with Rust in different ways.
The example app renders QR codes, initially using the pure JavaScript qrcode package. That ran at 1,464 req/sec, but switching it to calling a tiny Rust CLI wrapper around the qrcode crate using Node.js spawn() increased that to 2,572 req/sec.
This is yet another reminder to me that I need to get over my cgi-bin era bias that says that shelling out to another process during a web request is a bad idea. It turns out modern computers can quite happily spawn and terminate 2,500+ processes a second!
The article optimizes further first through a Rust library compiled to WebAssembly (2,978 req/sec) and then through a Rust function exposed to Node.js as a native library (5,490 req/sec), then finishes with a full Rust rewrite of the server that replaces Node.js entirely, running at 7,212 req/sec.
Full source code to accompany the article is available in the using-rust-in-non-rust-servers repository.
Cerebras Inference: AI at Instant Speed (via) New hosted API for Llama running at absurdly high speeds: "1,800 tokens per second for Llama3.1 8B and 450 tokens per second for Llama3.1 70B".
How are they running so fast? Custom hardware. Their WSE-3 is 57x physically larger than an NVIDIA H100, and has 4 trillion transistors, 900,000 cores and 44GB of memory all on one enormous chip.
Their live chat demo just returned me a response at 1,833 tokens/second. Their API currently has a waitlist.
Optimizing Datasette (and other weeknotes)
I’ve been working with Alex Garcia on an experiment involving using Datasette to explore FEC contributions. We currently have a 11GB SQLite database—trivial for SQLite to handle, but at the upper end of what I’ve comfortably explored with Datasette in the past.
[... 2,069 words]My architecture is a monolith written in Go (this is intentional, I sacrificed scalability to improve my shipping speed), and this is where SQLite shines. With a DB located on the local NVMe disk, a 5$ VPS can deliver a whopping 60K reads and 20K writes per second.
Performance analysis indicates that SQLite spends very little time doing bytecode decoding and dispatch. Most CPU cycles are consumed in walking B-Trees, doing value comparisons, and decoding records - all of which happens in compiled C code. Bytecode dispatch is using less than 3% of the total CPU time, according to my measurements.
So at least in the case of SQLite, compiling all the way down to machine code might provide a performance boost 3% or less. That's not very much, considering the size, complexity, and portability costs involved.
Optimizing SQLite for servers (via) Sylvain Kerkour's comprehensive set of lessons learned running SQLite for server-based applications.
There's a lot of useful stuff in here, including detailed coverage of the different recommended PRAGMA settings.
There was also a tip I haven't seen before about BEGIN IMMEDIATE transactions:
By default, SQLite starts transactions in
DEFERREDmode: they are considered read only. They are upgraded to a write transaction that requires a database lock in-flight, when query containing a write/update/delete statement is issued.The problem is that by upgrading a transaction after it has started, SQLite will immediately return a
SQLITE_BUSYerror without respecting thebusy_timeoutpreviously mentioned, if the database is already locked by another connection.This is why you should start your transactions with
BEGIN IMMEDIATEinstead of onlyBEGIN. If the database is locked when the transaction starts, SQLite will respectbusy_timeout.
DiskCache (via) Grant Jenks built DiskCache as an alternative caching backend for Django (also usable without Django), using a SQLite database on disk. The performance numbers are impressive—it even beats memcached in microbenchmarks, due to avoiding the need to access the network.
The source code (particularly in core.py) is a great case-study in SQLite performance optimization, after five years of iteration on making it all run as fast as possible.
Sometimes, performance just doesn't matter. If I make some codepath in Ruff 10x faster, but no one ever hits it, I'm sure it could get some likes on Twitter, but the impact on users would be meaningless.
And yet, it's good to care about performance everywhere, even when it doesn't matter. Caring about performance is cultural and contagious. Small wins add up. Small losses add up even more.
2023
Batch size one billion: SQLite insert speedups, from the useful to the absurd (via) Useful, detailed review of ways to maximize the performance of inserting a billion integers into a SQLite database table.
How CPython Implements and Uses Bloom Filters for String Processing. Fascinating dive into Python string internals by Abhinav Upadhyay. It turns out CPython uses very simple bloom filters in several parts of the core string methods, to solve problems like splitting on newlines where there are actually eight codepoints that could represent a newline, and a tiny bloom filter can help filter a character in a single operation before performing all eight comparisons only if that first check failed.
The most dramatic optimization to nanoGPT so far (~25% speedup) is to simply increase vocab size from 50257 to 50304 (nearest multiple of 64). This calculates added useless dimensions but goes down a different kernel path with much higher occupancy. Careful with your Powers of 2.
2022
Data-driven performance optimization with Rust and Miri (via) Useful guide to some Rust performance optimization tools. Miri can be used to dump out a detailed JSON profile of a program which can then be opened and explored using the Chrome browser’s performance tool.
Efficient Pagination Using Deferred Joins (via) Surprisingly simple trick for speeding up deep OFFSET x LIMIT y pagination queries, which get progressively slower as you paginate deeper into the data. Instead of applying them directly, apply them to a “select id from ...” query to fetch just the IDs, then either use a join or run a separate “select * from table where id in (...)” query to fetch the full records for that page.
Announcing Pyston-lite: our Python JIT as an extension module (via) The Pyston JIT can now be installed in any Python 3.8 virtual environment by running “pip install pyston_lite_autoload”—which includes a hook to automatically inject the JIT. I just tried a very rough benchmark against Datasette (ab -n 1000 -c 10) and got 391.20 requests/second without the JIT compared to 404.10 request/second with it.
Compiling Black with mypyc (via) Richard Si is a Black contributor who recently obtained a 2x performance boost by compiling Black using the mypyc tool from the mypy project, which uses Python type annotations to generate a compiled C version of the Python logic. He wrote up this fantastic three-part series describing in detail how he achieved this, including plenty of tips on Python profiling and clever optimization tricks.
Mypyc (via) Spotted this in the Black release notes: “Black is now compiled with mypyc for an overall 2x speed-up”. Mypyc is a tool that compiles Python modules (written in a subset of Python) to C extensions—similar to Cython but using just Python syntax, taking advantage of type annotations to perform type checking and type inference. It’s part of the mypy type checking project, which has been using it since 2019 to gain a 4x performance improvement over regular Python.
Tricking Postgres into using an insane – but 200x faster – query plan. Jacob Martin talks through a PostgreSQL query optimization they implemented at Spacelift, showing in detail how to interpret the results of EXPLAIN (FORMAT JSON, ANALYZE) using the explain.dalibo.com visualization tool.
2021
Weeknotes: datasette-tiddlywiki, filters_from_request
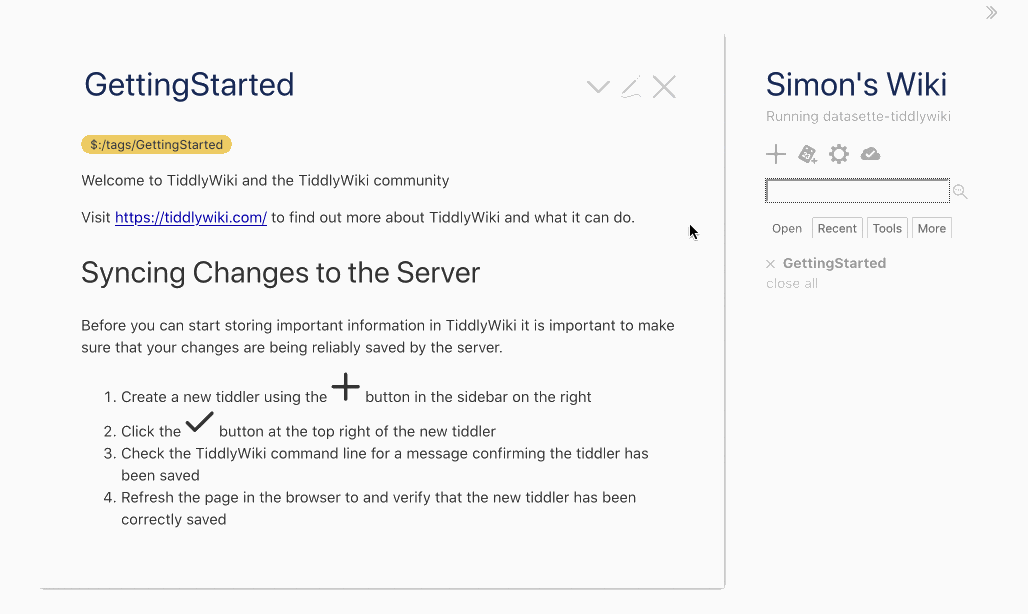
I made some good progress on the big refactor this week, including extracting some core logic out into a new Datasette plugin hook. I also got distracted by TiddlyWiki and released a new Datasette plugin that lets you run TiddlyWiki inside Datasette.
[... 1,197 words]Apply conversion functions to data in SQLite columns with the sqlite-utils CLI tool
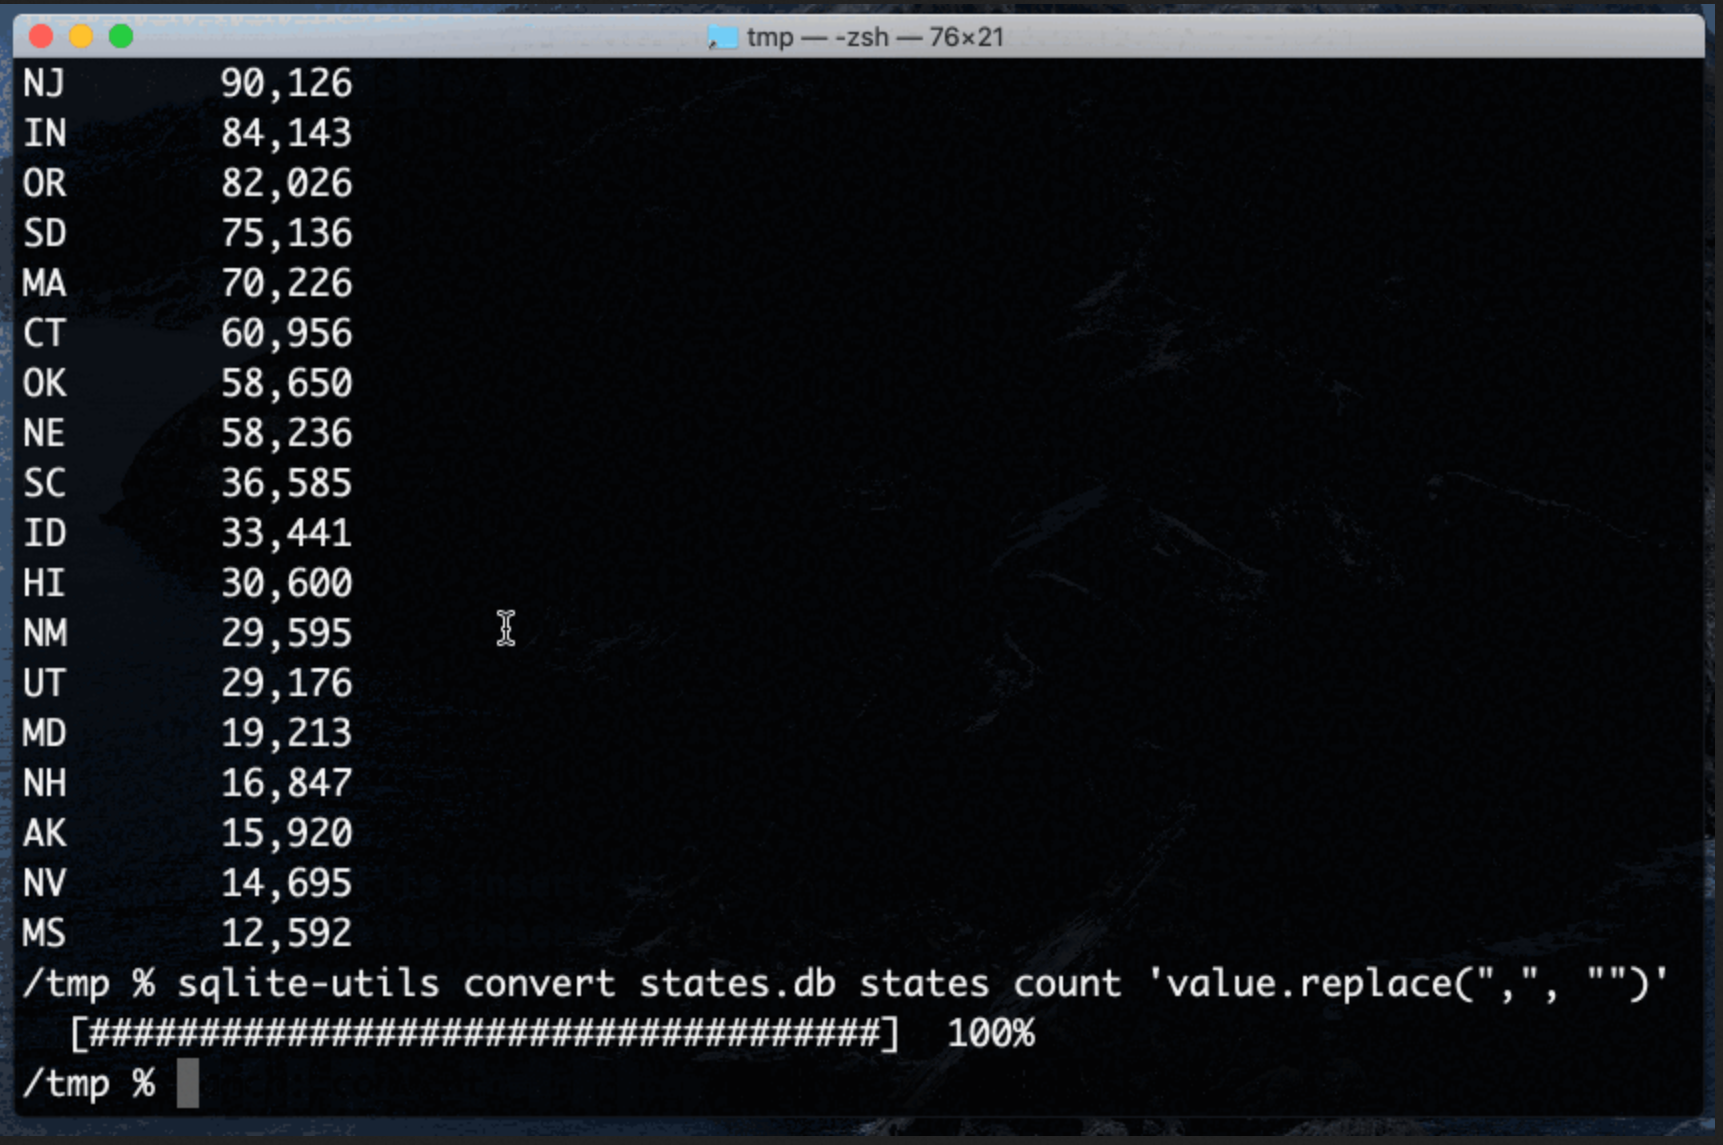
Earlier this week I released sqlite-utils 3.14 with a powerful new command-line tool: sqlite-utils convert, which applies a conversion function to data stored in a SQLite column.
When I was a performance consultant I'd show up to random companies who wanted me to fix their computer performance issues. If they trusted me with a login to their production servers, I could help them a lot quicker. To get that trust I knew which tools looked but didn't touch: Which were observability tools and which were experimental tools. "I'll start with observability tools only" is something I'd say at the start of every engagement.
Cleaning Up Your Postgres Database (via) Craig Kerstiens provides some invaluable tips on running an initial check of the health of a PostgreSQL database, by using queries against the pg_statio_user_indexes table to find the memory cache hit ratio and the pg_stat_user_tables table to see what percentage of queries to your tables are using an index.